Inventory is the stock of materials and goods an organisation keeps for use in production or for sale: raw materials, work-in-progress, finished goods and maintenance supplies. Inventory management is the planning, controlling and maintaining of that stock at the proper level, deciding what items to keep, how much to keep, when to reorder and how much to order, so that work continues smoothly without locking up excessive money.
The topic matters because inventory is usually one of the largest current assets on a manufacturer's or retailer's balance sheet. Too little stock stops production and loses sales; too much stock raises storage cost, blocks working capital and risks spoilage. The aim is not maximum stock but optimum stock: the right quantity, at the right time, at minimum total cost.
A simple way to understand inventory management
Think of a grocery shop. If it keeps too little rice, sugar and oil, customers leave empty-handed and sales are lost. If it keeps too much of everything, money is blocked, the storeroom is crowded and some items spoil. The shopkeeper must keep enough, but not too much. A notebook manufacturer faces the same problem with paper: too little and the machines stop; too much and warehouse cost rises and the paper may be damaged by moisture. Deciding how much paper to keep, when to order more and how much safety stock to hold is inventory management.
Inventory versus inventory management
Inventory is the stock itself. Inventory management is the process of controlling that stock properly.
Types of inventory
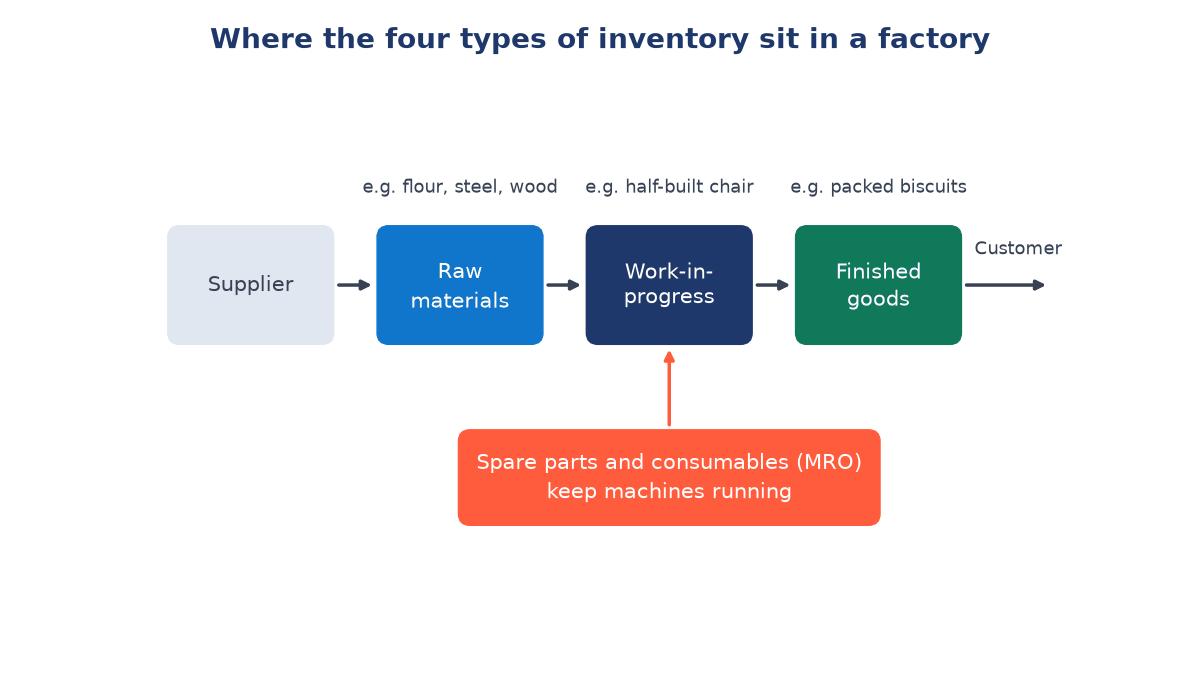
Raw materials
Basic materials that have not yet been processed: steel for a machine company, flour for a bakery, wood for a furniture maker.
Work-in-progress (WIP)
Items that have entered production but are not complete, such as a half-assembled chair on the shop floor.
Finished goods
Completed products ready for sale, such as packed biscuit boxes awaiting dispatch. They are held so customers can be served quickly.
Spare parts and consumables (MRO)
Maintenance, repair and operating supplies that keep operations running: lubricants, machine belts, nuts and bolts, cleaning materials.
Inventory by purpose
Textbooks also classify stock by the reason it is held:
| Type | Why it is held | Example |
|---|---|---|
| Cycle stock | Ordering in batches rather than one unit at a time | 800 notebooks bought every 20 days |
| Safety (buffer) stock | Protection against uncertain demand or supply | 60 extra notebooks kept in reserve |
| Anticipation stock | Expected peaks such as festivals or seasons | Extra sweets before Diwali |
| Pipeline (transit) stock | Goods moving between locations | Trucks carrying cement to depots |
| Decoupling stock | Lets one stage work independently of the next | WIP between cutting and stitching |
Why organisations hold inventory
- To support continuous production: if raw materials are missing, machines stop, workers are idle and orders are delayed.
- To meet customer demand: finished goods let customers be served immediately.
- To handle uncertainty: demand may rise suddenly and supply may be delayed; stock acts as protection.
- To cover lead time: suppliers take time to deliver, and stock is needed in the meantime.
- To gain from bulk buying: larger purchases may earn quantity discounts and lower transport cost per unit.
- To smooth production: a firm can produce at a steady rate while demand fluctuates.
In short, inventory exists because business conditions are never perfectly smooth.
Objectives and importance
The main objective is to maintain the right quantity of stock at the right time with minimum total cost, balancing availability against the cost of holding stock. Specific objectives are to:
- ensure material availability for smooth production;
- avoid both shortage and excess stock;
- minimise total inventory cost (ordering, carrying and shortage costs);
- improve customer service;
- make good use of working capital and storage space;
- prevent wastage, pilferage and obsolescence;
- support production planning and improve profitability.
Poor inventory management shows up quickly: production stops, goods are unavailable, storage cost rises and losses mount. That is why inventory management is one of the central functions of operations, closely linked with production planning and control (PPC), purchasing and stores.
Advantages of holding inventory and dangers at both extremes
Advantages of holding inventory
- Greater availability of materials and products when needed;
- smooth production without interruption;
- better customer service through quick delivery;
- protection against delay when a supplier is late;
- flexibility to respond to changes in demand.
| Problems of excess inventory | Problems of too little inventory |
|---|---|
| High carrying cost: storage, insurance, rent, security, handling | Stock-outs and production stoppage |
| Capital blocked that could be used elsewhere | Emergency purchases at higher prices |
| Damage, spoilage, rust and breakage | Customer dissatisfaction and missed sales |
| Obsolescence when designs or technology change | Overtime pressure and disrupted schedules |
| Valuable space occupied | Loss of goodwill to competitors |
Both extremes are harmful, which is why inventory management aims for balance.
Inventory-related costs
Ordering cost
The cost of placing and receiving one order: paperwork, communication, follow-up, transport arrangement, receiving and inspection. Total ordering cost rises with the number of orders. In a factory making its own parts, the equivalent is set-up cost.
Carrying (holding) cost
The expense of storing inventory for a specified period, usually a year: warehouse rent, insurance, security, interest on capital, deterioration and obsolescence. It is often expressed as a percentage of the item's value, for example 20% per year. Total carrying cost rises with the average stock held.
Shortage (stock-out) cost
The cost of not having stock when needed: lost sales, production stoppage, lost customer goodwill, urgent transport and emergency purchases at higher prices.
Purchase cost
The price paid for the items themselves. It becomes relevant when quantity discounts are offered.
Ordering cost and carrying cost pull in opposite directions: ordering more at a time reduces orders but raises average stock. The Economic Order Quantity (EOQ) model finds the balance.
Key planning concepts
Lead time
The time between placing an order and receiving the material. If bolts ordered today arrive after 5 days, lead time is 5 days.
Safety stock
Extra stock kept as protection against uncertainty in demand or lead time. A company that keeps a sufficient safety margin of extra inventory is said to hold safety stock; it is backup stock that should normally not be used.
Reorder point (reorder level)
A business should not wait until stock reaches zero. It orders when stock falls to the reorder point:
where is demand per day and is lead time in days.
Order cycle
The time between two successive orders. If orders go out on the 1st of every month, the order cycle is one month.
Average inventory
With steady use, stock falls from its highest level to its lowest in a straight line, so average inventory is half the order quantity plus any safety stock: .
Worked example: reorder point and annual inventory cost
Suppose a stationery wholesaler sells a popular notebook. The data are:
| Item | Value |
|---|---|
| Demand | 40 notebooks per working day |
| Working days per year | 300 |
| Order quantity | 800 notebooks |
| Lead time | 5 working days |
| Safety stock | 60 notebooks |
| Unit cost | ₹50 |
| Carrying cost | 20% of unit cost per year |
| Ordering cost | ₹300 per order |
Step 1: annual demand and number of orders
Step 2: order cycle
Step 3: reorder point
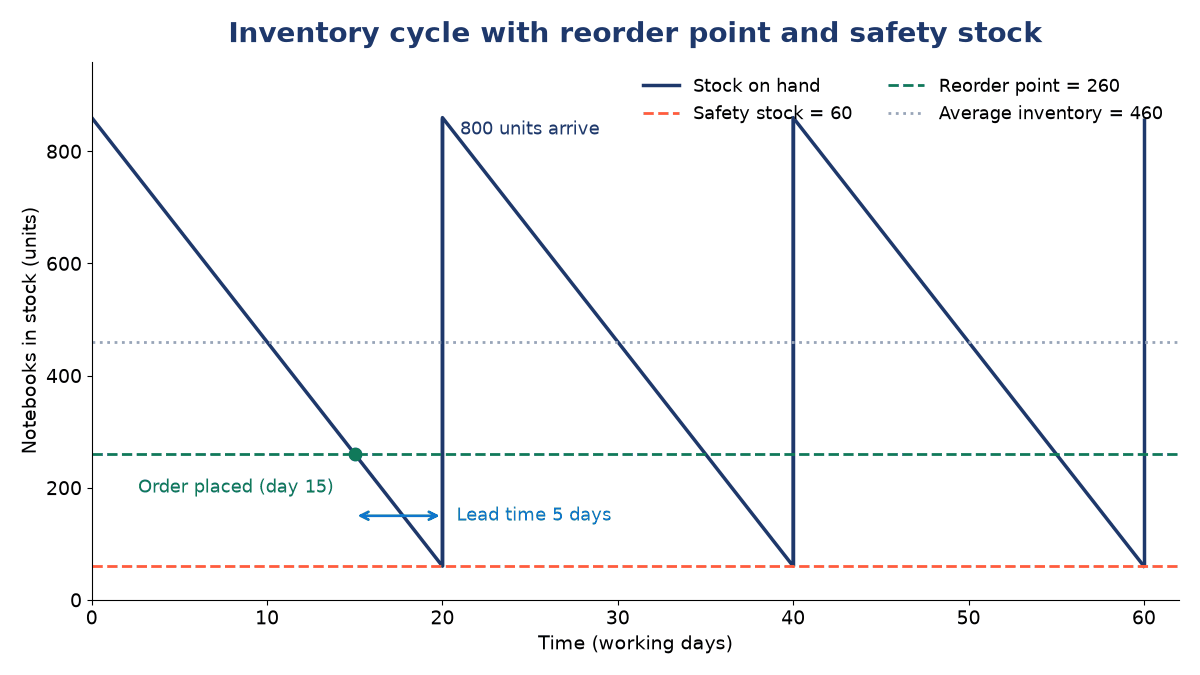
When stock falls to 260, an order for 800 is placed. Over the next 5 days, 200 notebooks are sold and the new lot arrives just as stock reaches the safety level of 60.
Step 4: average inventory and carrying cost
Step 5: ordering cost and total cost
Step 6: what if the order size changes?
| Order quantity | Orders per year | Average inventory | Ordering cost | Carrying cost | Total |
|---|---|---|---|---|---|
| 400 | 30 | 260 | ₹9,000 | ₹2,600 | ₹11,600 |
| 800 | 15 | 460 | ₹4,500 | ₹4,600 | ₹9,100 |
| 1,600 | 7.5 | 860 | ₹2,250 | ₹8,600 | ₹10,850 |
Ordering too little too often and ordering too much at once both cost more. The EOQ for these data is notebooks, so 800 is close to the economical size.
Factors affecting inventory levels
- Demand rate and its variability;
- lead time and supplier reliability;
- item cost and the cost of capital;
- storage capacity available;
- perishability and shelf life of the item;
- quantity discounts and price trends;
- nature of production (continuous or batch) and the desired service level.
Inventory management across sectors
Manufacturing
Manages raw materials, work-in-progress, finished goods and spare parts.
Retail
Mainly manages goods bought for resale, often thousands of product lines.
Service organisations
Hospitals, colleges and banks manage medicines, stationery, spare equipment and maintenance stock. Inventory is relevant almost everywhere, not only in factories.
Links with production, customer service and cost
Production: well-managed stock keeps materials available and flow smooth; badly managed stock stops machines, wastes labour and breaks schedules. Customer service: if finished goods are unavailable, sales are lost, customers switch to competitors and brand trust falls. Cost control: poor management raises storage, damage, capital and shortage costs; good management lowers them and improves efficiency.
Inventory control techniques
With hundreds or thousands of items, simply keeping stock is not enough. Firms use techniques such as ABC analysis (classification by annual value), EOQ (how much to order), reorder point (when to order), safety stock planning, VED and FSN analysis, perpetual inventory records, periodic review systems and, for dependent demand items, MRP. Just-in-time (JIT) systems go further and try to cut inventory to the minimum by synchronising supply with use.
Common problems and a good inventory system
Common problems
Inaccurate stock records, sudden demand change, delayed supply, poor storage, over-ordering, under-ordering, obsolete stock, duplicate stock under different codes, and poor coordination between departments.
Qualities of a good inventory system
- shows current stock clearly and accurately;
- supports timely ordering;
- prevents both shortage and excess stock;
- is easy to update;
- connects with purchase and stores;
- helps management make decisions quickly.
Stores management and inventory management
| Basis | Stores management | Inventory management |
|---|---|---|
| Focus | Physical custody of materials | Decisions about stock levels |
| Main activities | Receiving, storing, preserving, issuing | Deciding how much to hold, when and how much to order |
| Main concern | Safety, location, record of movement | Balancing cost and availability |
Key terms
- Inventory
- Stock of raw materials, work-in-progress, finished goods and supplies held for production or sale.
- Inventory management
- Planning and controlling stock at an optimum level to meet demand at minimum total cost.
- Lead time
- Time between placing an order and receiving the goods.
- Safety stock
- Extra stock held as a buffer against uncertain demand or supply.
- Reorder point
- Stock level at which a new order is placed; lead time demand plus safety stock.
- Order cycle
- Time between two successive orders.
- Ordering cost
- Cost of placing and receiving one order.
- Carrying cost
- Cost of holding one unit in stock for a period, usually a year.
- Shortage cost
- Cost arising from not having stock when it is needed.
Common questions
What is the main objective of inventory management?
To maintain optimum stock, enough to meet demand and keep production running, at the lowest total cost of ordering, carrying and shortages.
What are the types of inventory in a manufacturing firm?
Raw materials, work-in-progress, finished goods, and spare parts and consumables (MRO).
How is the reorder point calculated?
Multiply daily demand by lead time in days and add safety stock. With 40 units a day, a 5-day lead time and 60 units of safety stock, the reorder point is 260 units.
Why is excess inventory harmful?
It raises carrying cost, blocks working capital, occupies space and increases the risk of spoilage and obsolescence.
What is the difference between carrying cost and ordering cost?
Carrying cost rises when more stock is held on average; ordering cost rises when more orders are placed. Larger order sizes lower ordering cost but raise carrying cost.
Which factors decide how much inventory to keep?
Demand rate, lead time, supplier reliability, item cost, storage capacity, perishability, discounts and the service level the firm wants.
References
- Stevenson, W. J. Operations Management. McGraw-Hill Education.
- Heizer, J., Render, B. and Munson, C. Operations Management: Sustainability and Supply Chain Management. Pearson.
- Chary, S. N. Production and Operations Management. McGraw-Hill Education (India).
- Chopra, S. and Meindl, P. Supply Chain Management: Strategy, Planning, and Operation. Pearson.
- Harris, F. W. (1913) "How Many Parts to Make at Once". Factory, The Magazine of Management, 10(2), 135–136.