Inventory control techniques are the specific methods an organisation uses to keep stock under control: to decide which items deserve close attention, how much to order, when to order and how to check that records match reality. They turn the broad goal of inventory management, the right stock at minimum cost, into practical rules for thousands of individual items.
They matter because items are not equally important. A store holding 5,000 items will have some that are very costly and some that are cheap, some that move fast and some that hardly move, some that halt production if missing and some that nobody would miss for a week. Treating them all the same wastes management time on trivial items and leaves critical ones under-controlled. Techniques such as ABC, VED, FSN, EOQ and the reorder point solve this by matching the level of control to the item.
Need and objectives
Why techniques are needed
Uncontrolled stock creates familiar problems: too much stock raises carrying cost, too little causes shortages, important items run out, money is blocked in unnecessary items, storage space is wasted and records become difficult to manage.
Objectives
The main objective is to maintain optimum inventory with proper control at minimum cost. In practice this means to:
- classify stock and prioritise important items;
- keep enough stock for production and sales, but not too much;
- reduce investment in inventory and use capital better;
- improve availability and support smooth production;
- keep control over thousands of items with limited staff.
Inventory control is more than counting
Control means deciding which items need strict, moderate or simple control, when to reorder, how much to reorder and which items are critical to operations. Different techniques answer different parts of that question.
Overview of the main techniques
| Technique | Basis of classification or decision | Question it answers |
|---|---|---|
| ABC analysis | Annual consumption value | Which items tie up the most money? |
| VED analysis | Criticality to operations | Which items must never run out? |
| FSN analysis | Rate of movement (issue frequency) | Which items are fast, slow or dead? |
| HML analysis | Unit price | Which individual units are expensive? |
| SDE analysis | Ease of procurement | Which items are hard to obtain? |
| EOQ | Ordering versus carrying cost | How much to order? |
| Reorder point and safety stock | Lead time demand and uncertainty | When to order, and how much buffer? |
| Perpetual inventory and stock verification | Record keeping and physical checks | Are the records right? |
The first five are called selective inventory control techniques because they decide how much attention each item gets.
ABC analysis
ABC analysis is a selective control technique that classifies items into A, B and C classes according to their annual consumption value (annual usage quantity multiplied by unit cost). It applies the Pareto principle: a small number of items usually accounts for most of the money. The idea was popularised in industry by H. F. Dickie at General Electric. Typical, not fixed, proportions are:
| Class | Share of items | Share of value | Control |
|---|---|---|---|
| A | about 10–20% | about 60–80% | Strict: accurate records, frequent review, careful ordering, tight supervision |
| B | about 20–30% | about 15–25% | Moderate: normal control and regular review (average importance in value) |
| C | about 50–70% | about 5–10% | Simple: bulk ordering, less frequent review, less supervision |
Steps in ABC analysis
- List all items with their annual usage and unit cost.
- Multiply to get annual usage value for each item.
- Rank items in descending order of annual usage value.
- Calculate cumulative value and cumulative percentage of value and of items.
- Draw the cut-off lines to form classes A, B and C.
Worked example: ABC classification
Suppose the stores of an engineering workshop hold ten items with the following annual data.
| Item | Description | Annual usage (units) | Unit cost | Annual value | % of value | Cumulative % | Class |
|---|---|---|---|---|---|---|---|
| P1 | Electric motors | 1,000 | ₹700 | ₹7,00,000 | 35.0 | 35.0 | A |
| P2 | Control panels | 250 | ₹2,000 | ₹5,00,000 | 25.0 | 60.0 | A |
| P3 | Bearings | 4,000 | ₹60 | ₹2,40,000 | 12.0 | 72.0 | B |
| P4 | Seal kits | 500 | ₹400 | ₹2,00,000 | 10.0 | 82.0 | B |
| P5 | Drive belts | 800 | ₹200 | ₹1,60,000 | 8.0 | 90.0 | B |
| P6 | Gaskets | 3,000 | ₹20 | ₹60,000 | 3.0 | 93.0 | C |
| P7 | Bolts | 10,000 | ₹5 | ₹50,000 | 2.5 | 95.5 | C |
| P8 | Lubricating oil (litres) | 2,000 | ₹20 | ₹40,000 | 2.0 | 97.5 | C |
| P9 | Washers | 6,000 | ₹5 | ₹30,000 | 1.5 | 99.0 | C |
| P10 | Cable ties | 10,000 | ₹2 | ₹20,000 | 1.0 | 100.0 | C |
Total annual value:
Share of P1: . Proceeding the same way and cumulating gives the table above. The result:
- Class A = P1, P2: 2 items (20% of items) and ₹12,00,000 (60% of value).
- Class B = P3, P4, P5: 3 items (30% of items) and ₹6,00,000 (30% of value).
- Class C = P6 to P10: 5 items (50% of items) and ₹2,00,000 (10% of value).
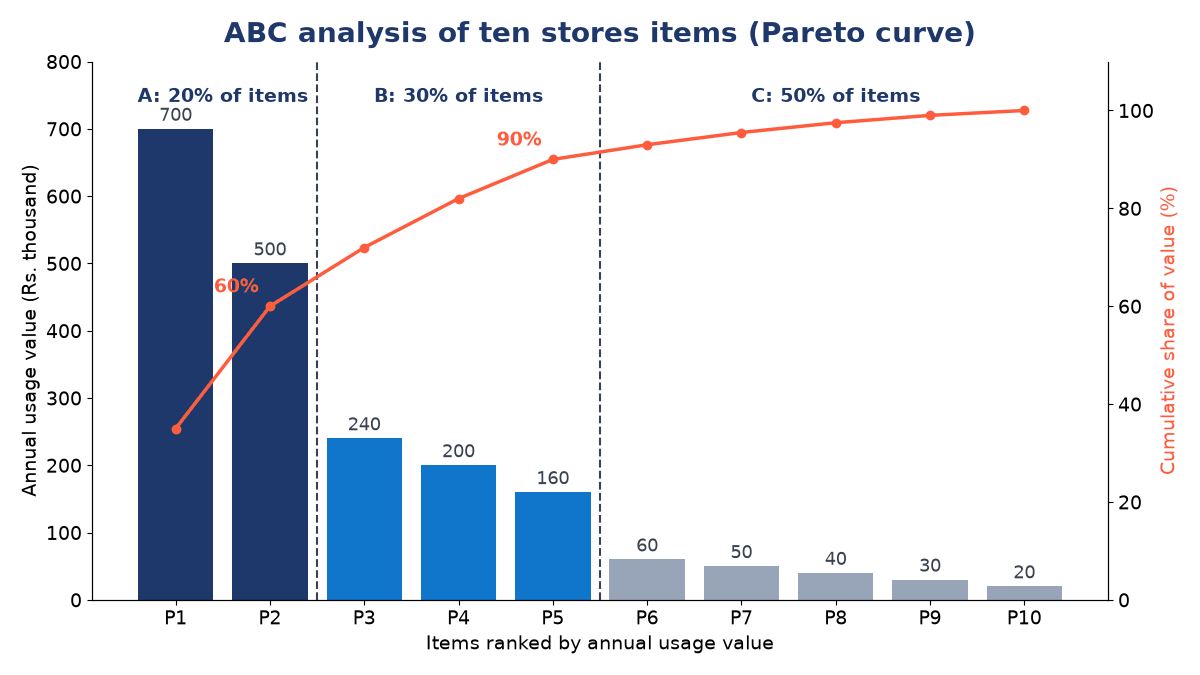
Management should therefore watch motors and control panels most closely, for example with EOQ-based ordering, weekly review and tight stock records, while bolts and cable ties can be bought in bulk and checked occasionally.
Advantages of ABC analysis
- better control over costly items;
- improved use of management time;
- reduced inventory investment;
- better purchasing decisions and simpler record control;
- especially useful in large organisations with many items.
Limitations of ABC analysis
- It considers only value, not criticality: a cheap part can stop a whole machine if unavailable.
- Classes change as prices and usage change, so the analysis must be repeated periodically.
- It needs accurate usage and cost data.
So ABC is helpful but should not be the only control method.
VED analysis
VED classifies items by criticality, and is widely used for spare parts, maintenance stores and hospital medicines.
- Vital: operations stop completely if these are unavailable (oxygen cylinders in a hospital, a critical machine spare). They must never be out of stock.
- Essential: important, but a short absence can be managed for a limited time.
- Desirable: useful but not immediately critical.
Combining ABC with VED
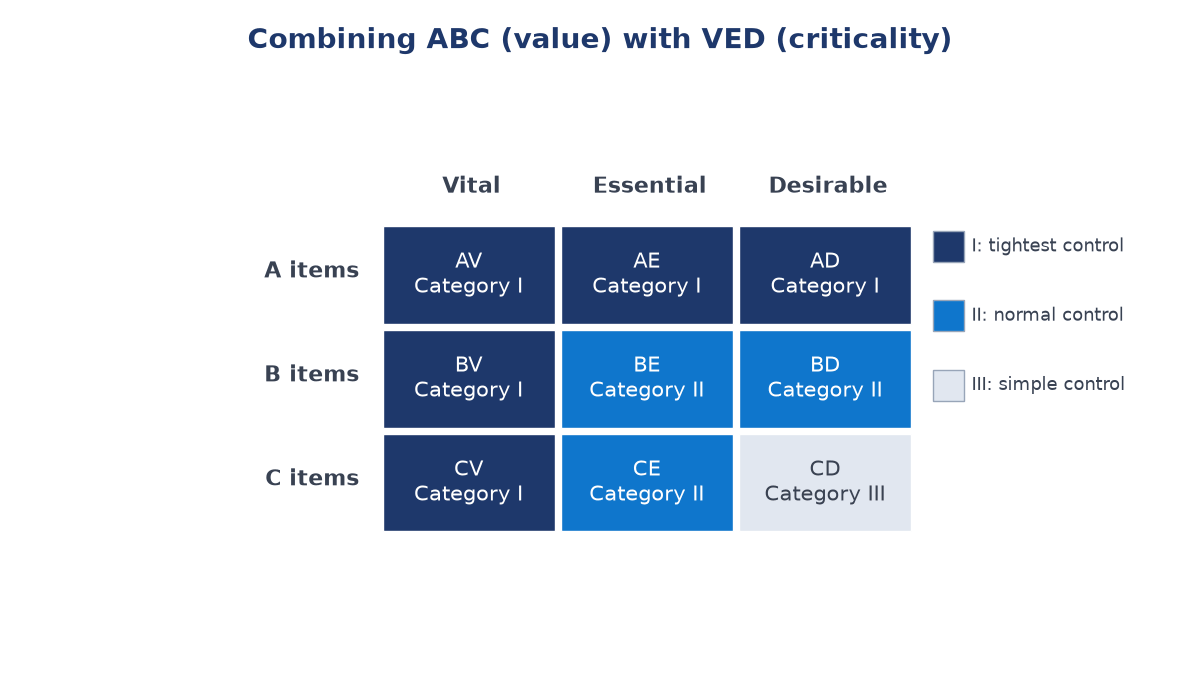
Because ABC asks "which items cost more?" and VED asks "which items are more critical?", many firms use both together in a nine-cell matrix. An item can be low cost but vital, and such an item still needs top-priority availability.
FSN analysis
FSN classifies items by rate of movement out of stores, usually judged by issue frequency or the time since the last issue.
- Fast moving: issued frequently; need regular replenishment.
- Slow moving: issued occasionally; need periodic review.
- Non-moving: not issued for a long time; candidates for disposal as obsolete or surplus stock.
FSN helps identify dead stock, free storage space and release money locked in idle items. ABC focuses on money importance, FSN on movement, so an item may be low value but fast moving, or high value but slow moving.
HML and SDE analysis
HML analysis
HML classifies items as High, Medium or Low cost by unit price. It helps management review expensive units carefully and control purchase decisions. It differs from ABC, which uses annual usage value rather than unit price: in the example above the control panel has the highest unit price (H), while bearings are only medium in price but still class B because of their volume.
SDE analysis
SDE classifies items by ease of procurement:
- Scarce: hard to obtain, often imported or single-source; need advance planning and higher stock.
- Difficult: available, but not easily or quickly.
- Easy: readily available in the local market.
SDE helps firms plan for supply risk.
EOQ, reorder point and safety stock
Economic Order Quantity
EOQ is the order size that minimises the total of annual ordering cost and carrying cost. Ordering too often raises ordering cost; ordering too much at once raises storage cost. The formula, due to F. W. Harris, is:
For the bearings (P3) in the example, suppose ordering cost is ₹150 per order and carrying cost is 20% of the ₹60 unit cost, so is ₹12 per bearing per year. With :
Safety stock
Safety stock is extra inventory kept as a safety margin against sudden demand increases, supplier delay, longer production times or urgent orders. Companies may also hold it in distribution centres to prepare for future demand. It reduces the risk of stock-out.
Reorder point
The reorder point tells the store when to order, before stock reaches zero:
If the workshop uses 16 bearings a day (4,000 over 250 working days), the lead time is 6 days and safety stock is 30, then:
So whenever bearing stock falls to 126, an order for about 316 bearings is placed. The reorder point prevents shortage, makes ordering systematic, matches stock to lead time and reduces emergency purchases.
Two-bin system
A simple physical version of the reorder point, common for C items: stock is kept in two bins, and when the first bin is empty the second (holding reorder-level stock) is opened and a new order is placed.
Record-based controls
Perpetual inventory system
Stock records (bin cards and stores ledger, or software) are updated every time material is received or issued, so the balance is always known. It reduces record errors, supports stock control, improves decisions and detects shortages early.
Periodic review system
Stock is checked at fixed intervals and topped up to a target level. It suits many small items ordered from the same supplier.
Stock verification
Physical checking of whether actual stock matches recorded stock, either at year-end or continuously on a rotating basis (continuous stock-taking). It detects loss, damage, theft, recording errors and obsolete materials.
Combining techniques in practice
Classification is useful because costly items need financial control, critical items need availability control, slow-moving items need disposal review and hard-to-buy items need advance planning. Real organisations therefore combine methods:
- ABC for value;
- VED for criticality;
- FSN for movement;
- EOQ for order size;
- reorder point for timing.
A hospital storing oxygen cylinders, injections, cotton, gloves and expensive imported equipment may use VED for critical medical items, ABC for costly items and reorder points for daily consumables. A factory may use ABC for spare parts; a retail store may use EOQ for regular stock ordering. These techniques apply in factories, hospitals, schools, retail stores, warehouses and maintenance departments.
Advantages and limitations
| Advantages | Limitations |
|---|---|
| Reduce excess stock and avoid shortage | Need accurate records and data |
| Better control of high-value and critical items | May ignore some real-life uncertainties |
| Improve stock visibility and ordering decisions | One technique alone may not be enough |
| Save storage cost and working capital | Classifications change over time and need review |
| Identify obsolete and slow-moving items | Poor implementation reduces usefulness |
Inventory management is the full system of planning and controlling stock; inventory control techniques are the tools inside that system.
Key terms
- Selective inventory control
- Applying different levels of control to different classes of items.
- ABC analysis
- Classification of items by annual consumption value into high, medium and low value classes.
- Annual consumption value
- Annual usage quantity multiplied by unit cost.
- VED analysis
- Classification by criticality into vital, essential and desirable items.
- FSN analysis
- Classification by rate of movement into fast, slow and non-moving items.
- HML analysis
- Classification by unit price into high, medium and low cost items.
- SDE analysis
- Classification by procurement difficulty into scarce, difficult and easy items.
- Reorder point
- Stock level that triggers a new order: lead time demand plus safety stock.
- Perpetual inventory
- A record system updated after every receipt and issue.
Common questions
What is the basis of ABC analysis?
Annual consumption value, that is annual usage multiplied by unit cost. It is not unit price alone, which is the basis of HML analysis.
How is ABC different from VED?
ABC classifies by money value; VED classifies by how critical the item is. A cheap item can be vital, so the two are often combined.
Why is ABC called selective inventory control?
Because it selects a small group of high-value items for strict control and allows simpler control for the many low-value items.
Which technique identifies dead stock?
FSN analysis, through its non-moving category.
What does EOQ tell that the reorder point does not?
EOQ tells how much to order; the reorder point tells when to order. They are used together.
Which technique suits a hospital pharmacy?
VED for life-saving drugs, usually combined with ABC for cost control and reorder points for routine consumables.
References
- Dickie, H. F. (1951) "ABC inventory analysis shoots for dollars, not pennies". Factory Management and Maintenance, 109(7), 92–94.
- Harris, F. W. (1913) "How Many Parts to Make at Once". Factory, The Magazine of Management, 10(2), 135–136.
- Chary, S. N. Production and Operations Management. McGraw-Hill Education (India).
- Panneerselvam, R. Production and Operations Management. PHI Learning.
- Stevenson, W. J. Operations Management. McGraw-Hill Education.