The theory of demand explains the relationship between the price of a good or service and how much of it consumers want to buy. It is usually shown as a demand curve that slopes downwards: as the price falls, the quantity demanded rises, and as the price rises, the quantity demanded falls.
Demand is the quantity of a good or service that consumers are willing and able to buy at each price during a period of time. The demand for a good at a given price reflects how much consumers are willing to pay and how much they expect to get out of consuming it. Goods range widely in price, from necessities to luxuries.
Necessities such as food, water, clothing, shelter and healthcare are needed by everyone, and are usually priced within most people's reach. A designer handbag, on the other hand, is sold at a premium, because it is a want and not something anyone needs to live a healthy life.
Demand for any good rests on two things: its utility (the satisfaction it gives) and the buyer's ability to pay. Both must be present. Demand exists only when a good gives some satisfaction and the consumer can afford it.
Demand therefore tells us how strongly people want a good and how much of it they actually buy, given their incomes and the utility they expect. Firms watch this closely and adjust their supply, which in turn moves prices.
For example, when a product suddenly becomes very popular, supply is scarce at first and the price goes up. Over time firms increase production, supply catches up, and the price comes back down.
Several factors affect demand, including:
- Consumer tastes and preferences
- Income
- Prices of related goods
Because so many things influence demand, businesses need to study it carefully. It is one of the most important inputs into decisions about growing the business and staying competitive.
Determinants of individual demand
The demand for a commodity rises or falls because of the following factors.
1. Price of the commodity itself
This is the most important factor. In general, price and quantity demanded are inversely related: as the price rises, the quantity demanded falls, because the good now gives less satisfaction for each rupee spent.
Example: if the price of tea rises, people buy less tea.
2. Prices of related goods
Demand for a commodity also changes when the prices of related goods change. Related goods are of two types.
Substitute goods can be used in place of one another to satisfy the same want, like tea and coffee. A rise in the price of a substitute increases the demand for the commodity, and a fall reduces it.
Example: if coffee becomes dearer, the demand for tea rises, because tea is now relatively cheaper. Demand for a commodity moves in the same direction as the price of its substitute.
Complementary goods are used together to satisfy a want, like tea and sugar. A rise in the price of a complement reduces the demand for the commodity, and a fall increases it.
Example: if sugar becomes dearer, the demand for tea falls, because using the two together now costs more. Demand for a commodity moves in the opposite direction to the price of its complement.
Examples of substitute goods:
- Tea and coffee
- Coke and Pepsi
- Pen and pencil
- CD and DVD
- Ink pen and ball pen
- Rice and wheat
Examples of complementary goods:
- Tea and sugar
- Pen and ink
- Car and petrol
- Bread and butter
- Pen and refill
- Brick and cement
3. Income of the consumer
Demand also depends on the consumer's income, but the effect depends on the kind of good.
For a normal good, a rise in income increases demand and a fall in income reduces it.
For an inferior good, a rise in income reduces demand and a fall in income increases it.
Example: when a family's income rises, it may buy less toned milk and more full-cream milk. For that family, toned milk is an inferior good and full-cream milk is a normal good.
4. Tastes and preferences
Tastes and preferences, shaped by fashion, customs and habits, directly influence demand. When a commodity is in fashion or preferred by consumers, its demand rises; when consumers lose interest in it, demand falls.
5. Expected change in future price
If people expect the price of a commodity to rise soon, they buy more of it now than they normally would. So an expected future price rise increases present demand.
Example: if the price of petrol is expected to rise, people fill their tanks today and its present demand increases.
Change in quantity demanded versus change in demand
Change in quantity demanded: when the demand for a commodity changes only because its own price has changed, it is called a change in quantity demanded. For example, if people buy more Pepsi because Pepsi has become cheaper, that is a change in quantity demanded.
Change in demand: when the demand for a commodity changes because of any factor other than its own price, it is called a change in demand. For example, if people buy more Pepsi because Coke has become dearer, or because incomes have risen, or because tastes have changed, that is a change in demand.
Determinants of market demand
Market demand depends on all the factors above, and on three more.
Size and composition of the population
A larger population raises market demand and a smaller one reduces it. The make-up of the population, that is, the proportion of men, women, children and elderly people, also matters. For example, a market with a larger share of women will have more demand for goods such as sarees and cosmetics.
Season and weather
Demand changes with the season. In winter, demand for woollen clothes and jackets goes up; in the rainy season, demand for raincoats and umbrellas goes up.
Distribution of income
When income is spread fairly evenly across the population, market demand for most commodities is higher. When income is very unevenly spread, with a few very rich people and many poor ones, market demand stays lower.
Demand function
A demand function shows the relationship between the quantity demanded of a commodity and the factors that influence it. It can be written for one consumer (the individual demand function) or for all consumers in the market (the market demand function).
Individual demand function
The individual demand function is the functional relationship between one consumer's demand and the factors affecting it. It is written as
Dx = f (Px, Pr, Y, T, F)
where
- Dx = demand for commodity x
- Px = price of commodity x
- Pr = prices of related goods
- Y = income of the consumer
- T = tastes and preferences
- F = expected change in price in future
Market demand function
The market demand function is the functional relationship between market demand and the factors affecting it. It can be written as
Dx = f (Px, Pr, Y, T, F, Po, S, D)
where
- Dx = market demand for commodity x
- Px = price of commodity x
- Pr = prices of related goods
- Y = income of the consumers
- T = tastes and preferences
- F = expected change in price in future
- Po = size and composition of the population
- S = season and weather
- D = distribution of income
Demand schedule
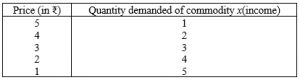
A demand schedule is a table showing the quantities of a commodity demanded at different prices during a given period. It shows the relationship between the price of the commodity and its quantity demanded.
A demand schedule can be drawn up for one buyer or for the whole market, so there are two types:
- Individual demand schedule
- Market demand schedule
An individual demand schedule is a table showing the quantities of a commodity that one consumer is willing to buy at different prices during a given period.
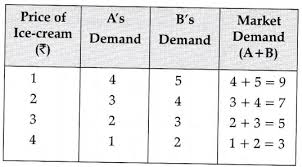
A market demand schedule is a table showing the quantities of a commodity that all consumers together are willing to buy at different prices during a given period. It is found by adding up the individual demands at each price:
Dm = DA + DB + …
where Dm is the market demand and DA, DB, … are the individual demands of household A, household B and so on.