The law of demand says that, other things remaining the same, the quantity demanded of a good moves in the opposite direction to its price. When the price rises, people buy less; when it falls, they buy more.
The law of demand is a basic principle of microeconomics. Used together with the law of supply, it explains how resources are allocated in a market and how the equilibrium price and quantity of a good are reached.
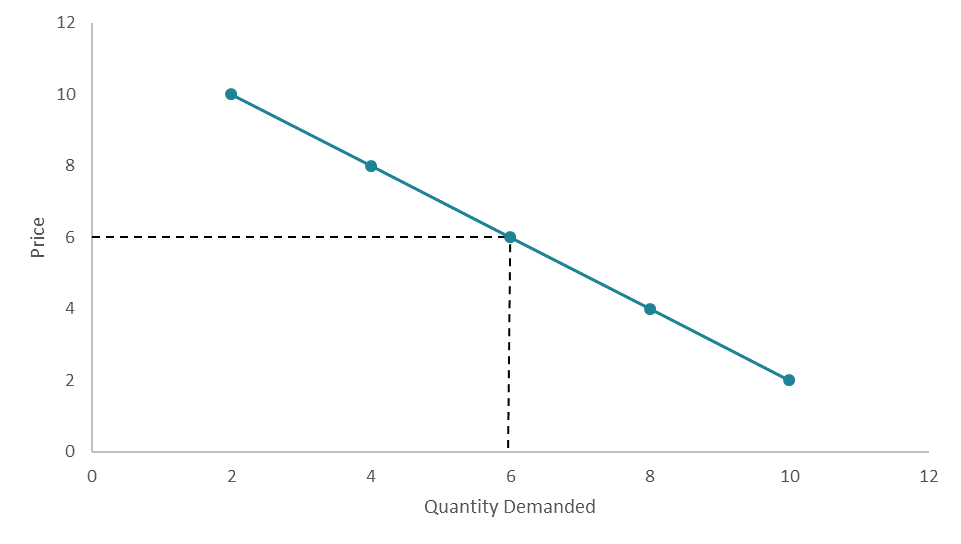
The law is usually shown as a graph. The demand curve shows the relationship between the price of a good and the quantity demanded at each price.
Its exact shape varies from good to good. It is often drawn as a curve bending towards the origin, but many economics textbooks draw it as a straight line for simplicity.
Quantity demanded is measured on the x-axis and price on the y-axis. Because price and quantity move in opposite directions, the demand curve slopes downwards from left to right.
Keep one distinction clear. The quantity demanded is the amount consumers are willing to buy at one particular price. Demand is the whole relationship between the good's price and the quantity demanded, that is, the entire curve.