Change in Quantity Demanded (Movement along Demand Curve)
Change in quantity demanded occurs when the quantity demanded of commodity changes due to a change in its price while the other factors remain constant. It is represented graphically as a movement along the same demand curve. There are two cases in movement along the same demand curve. It may be either a downward movement (expansion of demand) or an upward movement (contraction of demand). The graph below shows the movement of the demand curve DD. OQ is the quantity demanded at OP price. A change in price causes an upward or downward movement along this curve; the curve itself does not move.
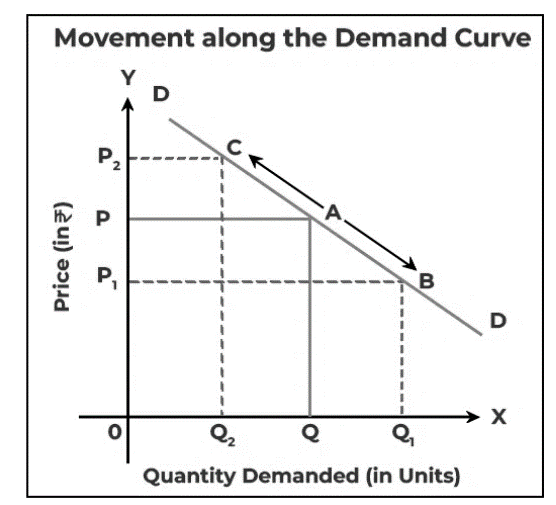
Upward Movement: When the price increases from OP to OP2, the quantity demanded decreases from OQ to OQ2 (also known as the contraction of demand), which results in an upward movement from A to C along the same demand curve DD.
Downward Movement: In contrast, a decrease in price from OP to OP1 causes a rise in quantity demanded from OQ to OQ1 (also known as the expansion of demand), which results in a downward movement along the same demand curve DD from A to B.
Expansion in Demand
When there is an increase in the quantity demanded of a commodity because of a fall in its price by keeping other factors constant, it is known as an Expansion in Demand. Expansion in demand results in a downward movement along the same demand curve. It is also known as an Extension in Demand or Increase in Quantity Demanded.
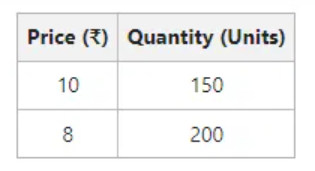
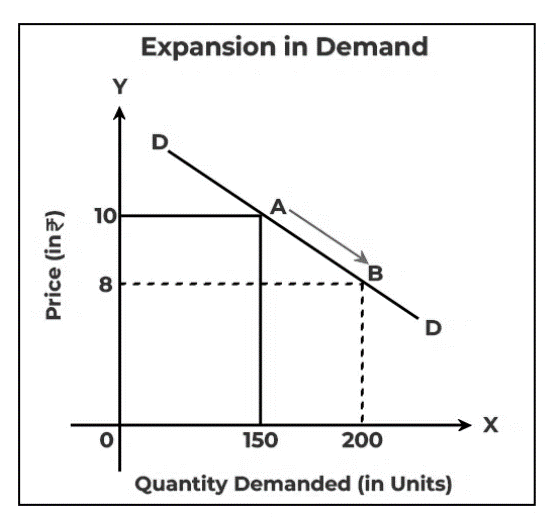
The quantity demanded increases from 150 to 200 units as shown in the above schedule and diagram because of a fall in price from ₹10 to ₹8, leading to a downward movement along the same demand curve DD from A to B.
Contraction in Demand
When there is a fall in the quantity demanded of a commodity because of an increase in its price by keeping other factors constant, it is known as Contraction in Demand. Contraction in demand results in an upward movement along the same demand curve. It is also known as a Decrease in Quantity Demanded.
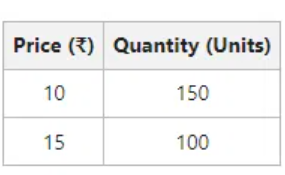
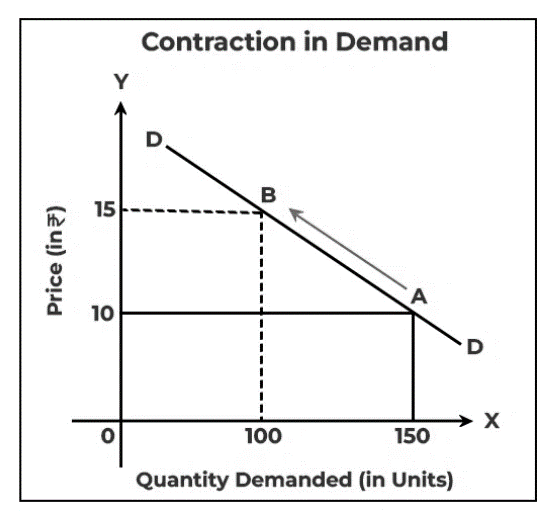
The quantity demanded decreases from 150 to 100 units as shown in the above schedule and diagram because of a rise in price from ₹10 to ₹15, leading to an upward movement along the same demand curve DD from A to B.
Change in Demand (Shift in Demand Curve)
A demand curve is used to show the relationship between a commodity’s price and quantity demanded, assuming that all other factors remain constant. However, sooner or later, other factors will be bound to change. When one of the other factors changes, the demand curve shifts. For instance, assume that the income of the consumer rises. Even though the price of a commodity has not changed, the consumer’s desire for that product may increase. The original demand curve cannot show such an increase in desire for any product whose price has not changed. It will result in a shift in the demand curve.
Change in demand occurs when the demand for a commodity changes as a result of a change in a factor other than the price of the commodity. It is referred to as the shift in the demand curve. There are two cases in the ‘shift in demand curve’. It may be either a rightward shift (increase in demand) or a leftward shift (decrease in demand).
The graph below shows the shift in demand curve DD.
OQ is the quantity demanded at OP price. A rightward or leftward shift in the demand curve is caused by changes in factors other than the price of the commodity.
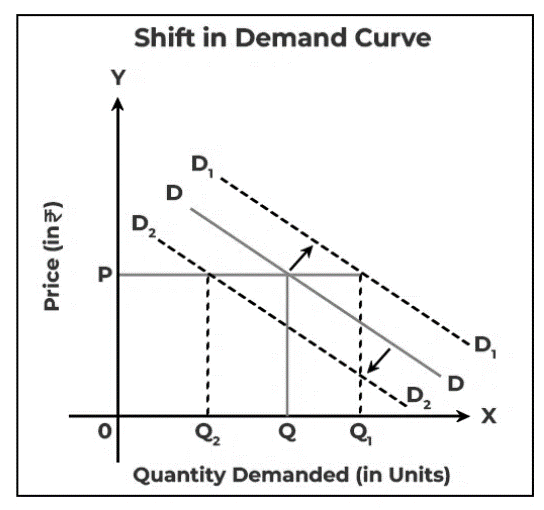
Rightward Shift: The demand curve shifts to the right from DD to D1D1 when demand increases from OQ to OQ1 (also known as an increase in demand) at the same price as OP. It is also known as Outward Shift, Forward Shift, or Upward Shift.
Leftward Shift: The demand curve shifts to the left from DD to D2D2 when demand decreases from OQ to OQ2 (also known as a decrease in demand) at the same price as OP. It is also known as Inward Shift, Backward Shift, or Downward Shift.
Increase in Demand
When there is an increase in the quantity demanded of a commodity because of any factor other than the price of the commodity, it is known as an Increase in Demand. In simple terms, the demand for a commodity increases at the same price, because of changes in other factors. An increase in demand results in a rightward shift in the demand curve.
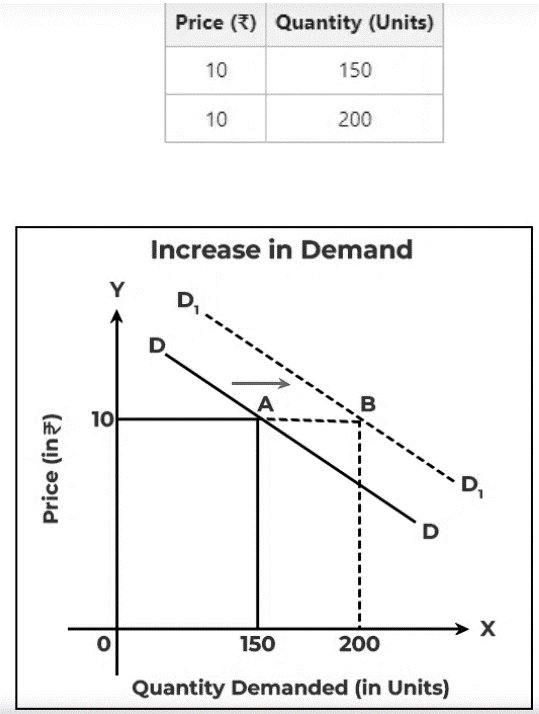
The demand increases from 150 units to 200 units at the same price of ₹10, as shown in the above schedule and diagram, which causes a rightward shift in the demand curve from DD to D1D1.
Decrease in Demand
When there is a fall in the quantity demanded of a commodity because of any factor other than the price of the commodity, it is known as Decrease in Demand. In simple terms, the demand for a commodity decreases at the same price, because of changes in other factors. A decrease in demand results in a leftward shift in the demand curve.
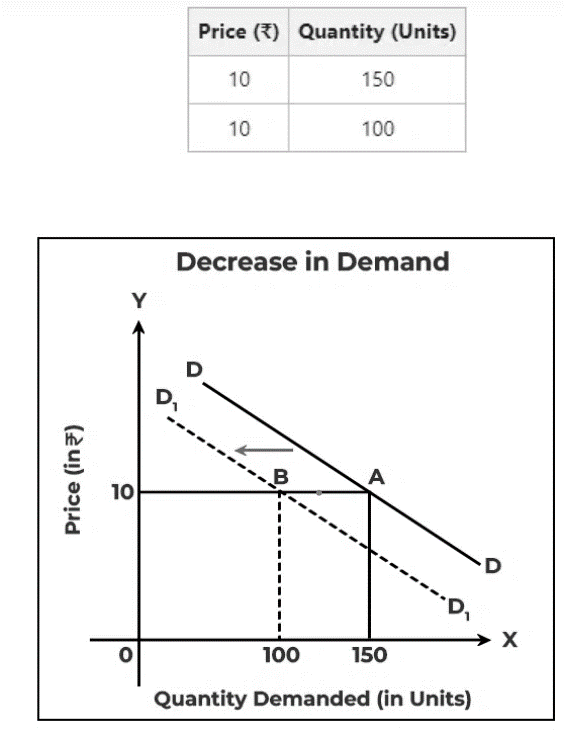
The demand decreases from 150 units to 100 units at the same price ₹10, as shown in the above schedule and diagram, which causes a leftward shift in the demand curve from DD to D1D1.
Causes of Change in Demand
A change in demand is caused by a change in factors other than the commodity's own price, such as:
- Change in the price of substitute goods;
- Change in the price of complementary goods;
- Change in the income of consumers;
- Change in tastes and preferences;
- Expectation of change in price in future;
- Change in population;
- Change in distribution of income; and
- Change in season and weather.