The long-run average cost curve is an envelope of short-run cost curves. A worked graph shows how a firm picks the plant size that gives the lowest cost for its planned output.
The long-run production cost curve shows the relationship between cost and output in the long run. In other words, it shows the total cost of production for a given quantity of output. The term production cost refers to average total cost.
Generally, when looking toward the long run, for each level of output, the firm can choose a different level of investment that would minimize the average total cost for that level of output. The firm invests in a level of capacity, say the size of the warehouse, or the acres of land, and that determines the firm's short-run cost curve. It may, for instance, increase the fixed costs, but decrease the variable costs, allowing the firm to produce larger and larger quantities for a lower per-unit cost. This means that if a firm has a certain level of output in mind, it must choose the investment that results in the lowest average total cost.
Most firms have several possible levels of capacity to choose from. At any moment the firm is on one short-run average total cost curve, set by its present capacity, but each other capacity level it could choose has its own curve. So a firm looking at its long-run options faces several possible short-run average total cost curves.
In the short run, a change in quantity is a movement along the short-run total cost curve. However, in the long run, a change in quantity can be accompanied by a change in capacity level that increases fixed costs but decreases variable costs, such that in the long run, the average total long-run cost for the new level of output is minimized. That is, in the long run, the firm can choose to put itself on a different short-run total cost curve.
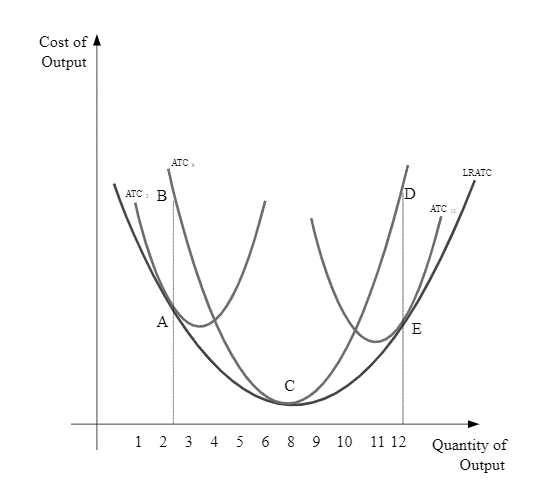
The result is a long-run average total cost curve that wraps around, or envelops, all the short-run average total cost curves. The figure below shows this.
In the figure, the firm examines this long-run average total cost curve (LRATC) and targets an output of eight units. However, the firm also considers two other options: two units of output and twelve units of output. The short-run average total cost curves for these options are shown in the graph and labelled ATC.
Figure shows the long-run production cost curve with the short-run production cost curves in it.
By choosing an investment level that minimizes the short-run average total cost for a quantity of eight, the firm will be at point C in the graph. However, if the firm anticipates a production of two units in the long run, it will decrease its capacity investment and instead be at point A in the graph.
Note that the minimum point on ATC2 is not as low as the minimum point on ATC8. Therefore, the average total cost of production is higher at point A than at point C. However, point A represents the lowest possible average total cost for the production of two units.
Finally, if the firm anticipates a production of twelve units it will invest in getting to point E, by putting itself on the short-run curve ATC12. Note that if the firm decides to pursue a quantity of eight, and then wants to change to a quantity of two or twelve, then in the short run, the firm will be at point B or D, respectively, until it can get out of its short-run cost constraints. This is why it's very important to choose optimally in the first place.
What all this is saying is that if the firm makes a long-run decision and chooses a short-run cost curve that matches its planned level of output, then it will stay on the long-run average total cost curve (in addition to its existing short-run cost curve). However, if market conditions change and the firm wants to produce a different quantity, then in the short run it will be off the long-run average cost curve, at a higher cost, until it can adjust its capacity.
Long-run average total cost is a business metric that represents the average cost per unit of output over the long run, where all inputs are considered to be variable and the scale of production is changeable.