Mode of Grouped Data Class 10: Formula and Examples
Learn the Class 10 mode formula for grouped data, what each symbol means and why it works, with worked examples including a modal class at the start, a missing frequency, and mean versus mode.
The mode is the value that occurs most often. A shoe shop wants the most common shoe size, a bus depot wants the busiest time of day, and a clothing brand wants the size that sells most: all of these are questions about the mode. For ungrouped data you simply spot the most frequent value. For grouped data we first find the class with the highest frequency and then use a formula to estimate where inside that class the mode lies. This lesson explains the formula, what each symbol means, why it works, and how it compares with the mean.
In a grouped frequency distribution, the modal class is the class interval with the largest frequency. The mode lies somewhere inside this class. Finding the modal class is always the first step; if you pick the wrong class, every later step is wrong.
The denominator can be written as (f1−f0)+(f1−f2). So the fraction
(f1−f0)+(f1−f2)f1−f0
compares how much the modal class rises above its left neighbour with the total rise above both neighbours. If both neighbours are equal (f0=f2), the fraction is 21 and the mode is the exact middle of the class. If the class after is much smaller than the class before, the fraction is less than 21 and the mode is pulled towards the left end, towards the bigger neighbour. The mode always leans towards the heavier side.
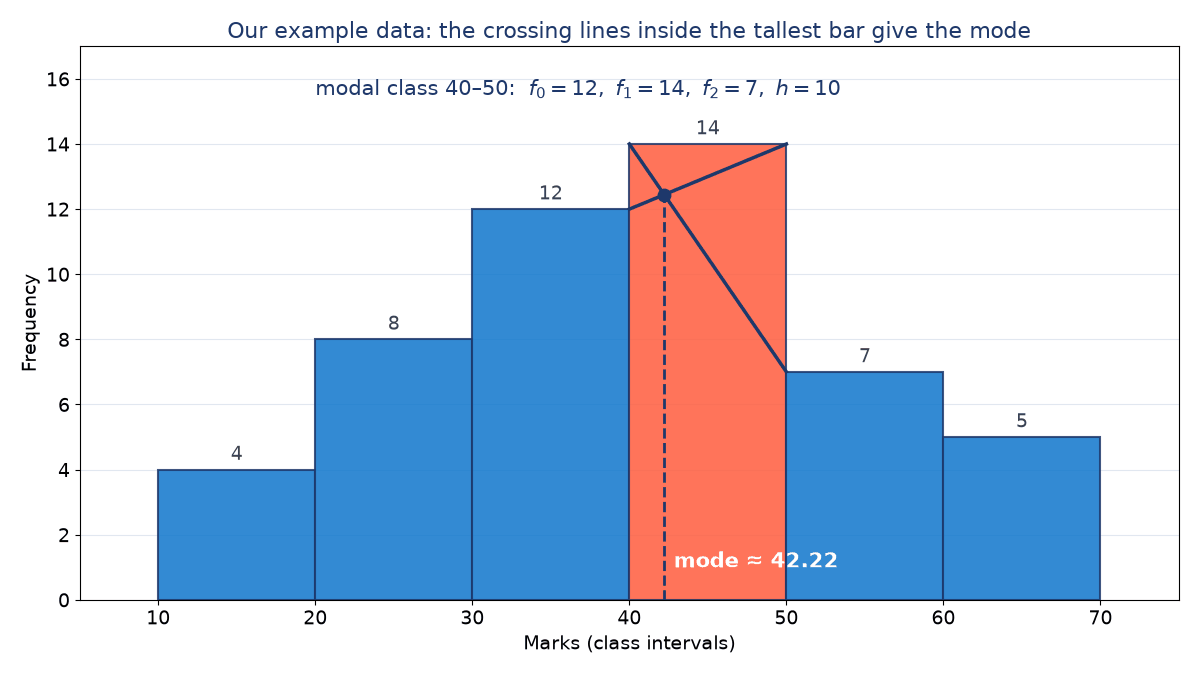
There is also a neat picture. On the histogram, join the top-left corner of the modal bar to the top-left corner of the next bar, and the top-right corner of the modal bar to the top-right corner of the previous bar. These two lines cross at a point whose horizontal position is exactly the mode given by the formula. Taking the left edge of the modal class as position 0 and writing t for the fraction of the width, the first line has height f1+t(f2−f1) and the second has height f0+t(f1−f0). Setting them equal:
Check that the classes are continuous and of equal width. If the classes are written as 10–19, 20–29, convert them to 9.5–19.5, 19.5–29.5 and so on.
Find the largest frequency. Its class is the modal class; write down l and h.
Read f1, then f0 from the row above and f2 from the row below. Use 0 if a neighbour does not exist.
Work out f1−f0 and 2f1−f0−f2 separately.
Substitute, simplify, and check that the answer lies between l and l+h.
The mode is about 42.22 marks: more students scored around 42 than around any other mark. It lies in 40–50, as it must, and is pulled slightly left because the class before (12) is much larger than the class after (7).
A clinic records how long 24 patients waited (our own data). Find the modal waiting time.
Time (minutes)
0–5
5–10
10–15
15–20
20–25
Patients
9
6
4
3
2
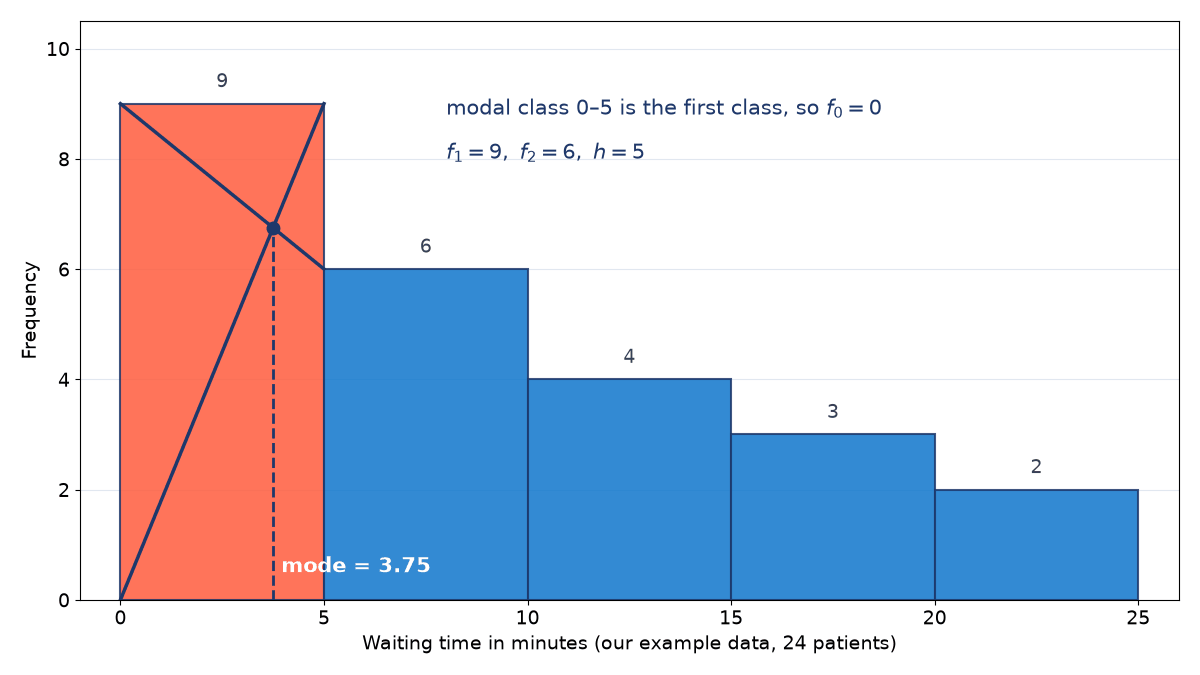
The largest frequency, 9, is in the first class 0 to 5. There is no class before it, so f0=0. We have l=0, h=5, f1=9, f2=6.
Mode=0+2(9)−0−69−0×5=129×5=1245=3.75
The modal waiting time is 3.75 minutes. For comparison, the mean of this table is 24215≈8.96 minutes, much larger, because a few patients waited a long time. When data is bunched at one end like this, the mode describes the typical patient better than the mean.
Example 2: with no class before the first one, f0=0, so one line starts from the axis. The lines cross above 3.75.
Example 3: wages, and comparing mode with mean#
For the daily wages of 50 workers below (our own data), the mean is ₹523. Find the mode and compare the two.
Wage (₹)
400–450
450–500
500–550
550–600
600–650
Workers
5
12
18
10
5
Modal class 500–550: l=500, h=50, f1=18, f0=12, f2=10.
The modal wage is about ₹521.43, while the mean is ₹523. They are close because the table is nearly balanced on both sides of the modal class. The mode tells us the most common wage; the mean tells us what each worker would get if the total wage bill were shared equally.
The mode answers "what is most typical or most popular?". It is the natural average for sizes, choices and busiest times.
The mean uses every observation, so a few very large or very small values pull it towards them. The mode is not affected by such extreme values.
When the data is roughly symmetric, the mean and mode are close (Example 3). When the data is bunched at one end, they can be far apart (Example 2).
A distribution can have two classes with the same highest frequency. Then it is called bimodal, and the single-mode formula should not be forced onto it.
Can the mode formula give a value outside the modal class?#
No. Since f1 is the largest frequency, both f1−f0 and f1−f2 are non-negative, so the fraction lies between 0 and 1 and the mode lies between l and l+h.
What if two classes have the same highest frequency?#
The data is bimodal and the formula does not pick a single answer. Class 10 questions are set so that there is one clear modal class.
No. It depends on the shape of the data. In Example 2 the mode is far below the mean; if most values were near the top end, the mode could be above the mean.
Why does the mode not depend on the other classes?#
The formula looks only at the modal class and its two neighbours, because the mode is about where values are most crowded, not about the total or the extremes.