Median of Grouped Data and the Empirical Relation, Class 10
Find the median of grouped data using cumulative frequency and the median class, convert inclusive classes, solve for missing frequencies, and use the empirical relation between mean, median and mode.
The median is the middle value of data arranged in order: half the observations lie below it and half above. It is the average to use when a few extreme values would distort the mean, for example household incomes or house prices. For grouped data we find the class that contains the middle observation and then estimate the median inside it with a formula. This lesson covers cumulative frequency, the median formula, inclusive classes, missing frequencies, and the empirical relationship that links the mean, median and mode.
The cumulative frequency (cf) of a class is the total of the frequencies of that class and all classes before it. It tells you how many observations are less than the upper limit of that class. The last cumulative frequency always equals n, the total number of observations; this is a useful check.
Work out 2n. The median class is the first class whose cumulative frequency is greater than or equal to 2n. The middle observation lies in this class.
Up to the lower limit l there are already cf observations. To reach the middle, we need 2n−cf more observations, and these must come from the median class. The median class has f observations spread over a width h. Assuming they are spread evenly, each observation takes up a width of fh, so 2n−cf observations take up
(2n−cf)×fh
Adding this to l gives the formula. The "evenly spread" assumption is why the grouped median is an estimate.
If the classes are inclusive (such as 11–15, 16–20), make them continuous: find half the gap between one upper limit and the next lower limit, subtract it from every lower limit and add it to every upper limit.
Make a cumulative frequency column. Check that the last entry is n.
Work out 2n and find the first class with cf≥2n. This is the median class.
Read l, f, h, and cf of the class before it.
Substitute and simplify. Check that the answer lies inside the median class.
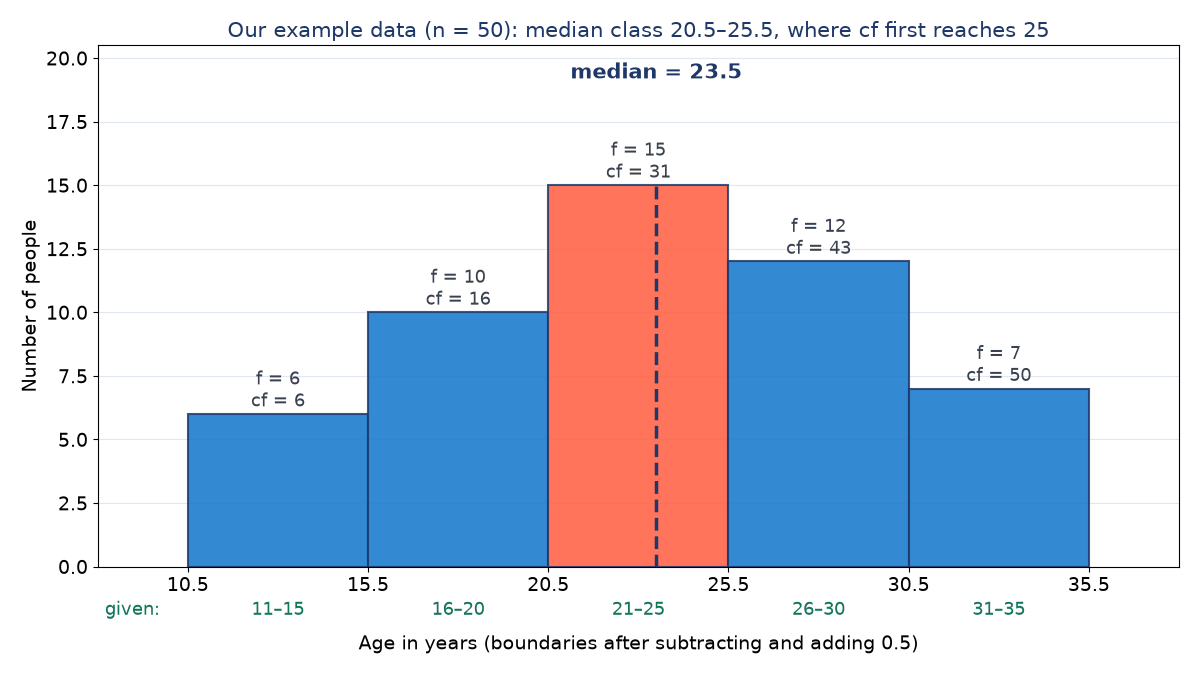
Find the median age of 50 people at a camp (our own data).
Age (years)
11–15
16–20
21–25
26–30
31–35
People
6
10
15
12
7
There is a gap between 15 and 16. Half the gap is 216−15=0.5, so subtract 0.5 from each lower limit and add 0.5 to each upper limit.
Age (continuous)
f
cf
10.5–15.5
6
6
15.5–20.5
10
16
20.5–25.5
15
31
25.5–30.5
12
43
30.5–35.5
7
50
2n=25, so the median class is 20.5–25.5, with l=20.5, cf=16, f=15, h=5.
Median=20.5+1525−16×5=20.5+1545=20.5+3=23.5
The median age is 23.5 years. Using 21 instead of 20.5 as l would have given 24, a wrong answer.
Example 2: the inclusive classes become continuous classes with boundaries 10.5, 15.5, …, 35.5. The median class is the first whose cumulative frequency reaches 25.
The distribution below has 60 observations and its median is 25. Find x and y.
Class
0–10
10–20
20–30
30–40
40–50
50–60
Frequency
4
x
18
y
9
5
The median 25 lies in 20–30, so that is the median class: l=20, f=18, h=10, 2n=30. The cumulative frequency before it is cf=4+x.
20+1830−(4+x)×1018(26−x)×1026−xx=25=5=9=17
From the total: 4+17+18+y+9+5=60, so 53+y=60 and y=7.
Check: the cumulative frequencies are 4, 21, 39, 46, 55, 60. The first to reach 30 is 39, in 20–30, as assumed, and 20+1830−21×10=20+5=25. So x=17, y=7.
For many distributions that are only moderately lopsided, the three averages are linked approximately by
3Median=Mode+2Mean
It is called empirical because it comes from observation of real data, not from a proof. It lets you estimate one average when the other two are known. In an exam, use it only when the question asks you to, or when only two averages are given.
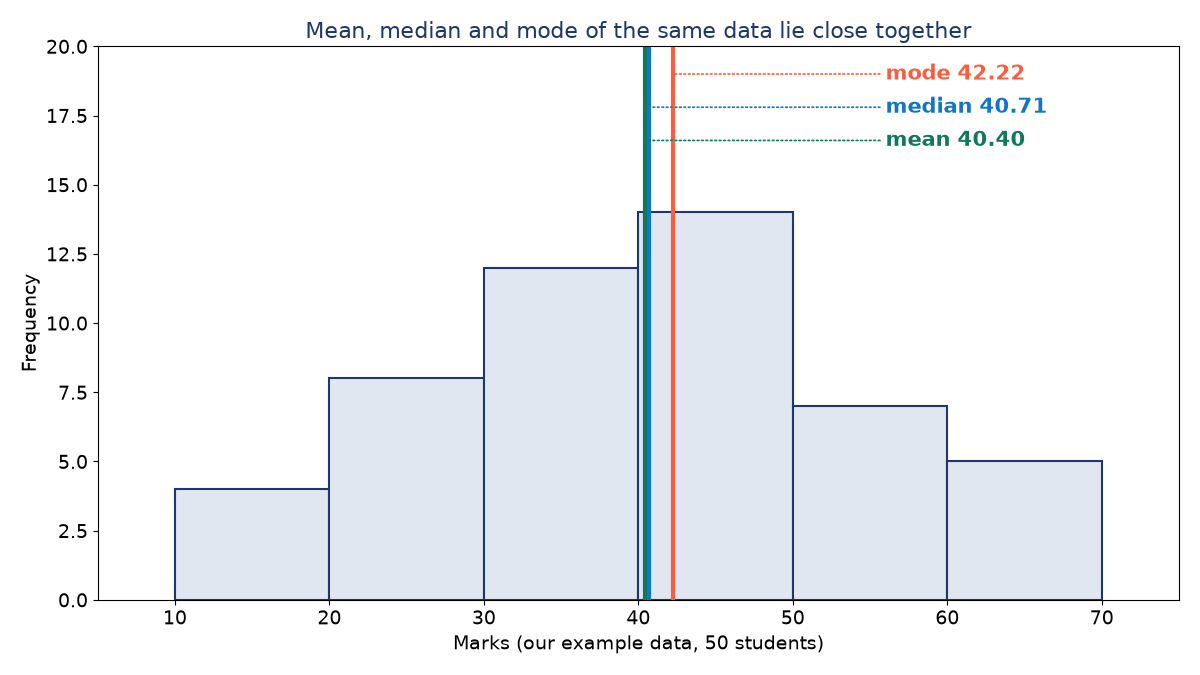
For the marks data of Example 1, the mean is 40.4 and the mode (by the mode formula) is about 42.22. We found the median to be about 40.71. Check the relation.
The two sides differ by less than 1, so the relation holds approximately. If we had used it to estimate the mode, we would have got 122.14−80.8=41.34, against the formula value of 42.22. Good enough as an estimate, but not a replacement for the mode formula.
Mean, median and mode of the Example 1 data. The median lies between the mean and the mode, as it usually does.
Mean: when every value matters and there are no extreme values, for example the average marks of a class or average rainfall.
Median: when a few very large or very small values would pull the mean away from the typical value, for example incomes, or when the last class is open-ended.
Mode: when you want the most common or most popular value, for example the most sold shoe size.
Why do we use n/2 and not (n + 1)/2 for grouped data?#
For grouped data we treat the observations as spread continuously through each class, so the point that splits the total in half is at 2n. The 2n+1 rule is for listing individual ungrouped values.
What if n/2 equals a cumulative frequency exactly?#
Then that class is the median class, and the formula gives its upper limit as the median. For example, if cf=25 for 30–40 and 2n=25, the median is 40.
Do I have to convert inclusive classes for the median?#
Yes. The lower limit l must be a true boundary, so convert before reading l. The class width h is unchanged.
No. It is an approximation that works well for moderately lopsided data, as Example 5 shows. Use it only when asked or when two averages are given.
Which average is best when the last class is "60 and above"?#
The median, because it does not need the class mark of the open class, whereas the mean does.