This set practises every skill in the Class 10 Statistics chapter: the mean of grouped data by the direct, assumed mean and step-deviation methods, the mode, the median, missing frequencies, and the empirical relationship between the three averages. All the data below is our own. Try each question before reading the solution, and check that each answer lies inside the right class.
Quick recap#
Mean of grouped data#
Question 1#
The number of books read in a year by 30 students is shown. Find the mean number of books by the direct method.
Solution. The class marks are 3, 9, 15, 21, 27.
∑ f i = 3 + 7 + 10 + 6 + 4 = 30 ∑ f i x i = 9 + 63 + 150 + 126 + 108 = 456 x ˉ = 456 30 = 15.2 \displaystyle \begin{aligned} \sum f_i &= 3 + 7 + 10 + 6 + 4 = 30 \\ \sum f_i x_i &= 9 + 63 + 150 + 126 + 108 = 456 \\ \bar{x} &= \dfrac{456}{30} = 15.2 \end{aligned} ∑ f i ∑ f i x i x ˉ = 3 + 7 + 10 + 6 + 4 = 30 = 9 + 63 + 150 + 126 + 108 = 456 = 30 456 = 15.2
Answer: the mean is 15.2 books.
Question 2#
The monthly electricity use of 50 homes is given. Find the mean by the assumed mean method.
Solution. Take a = 100 a = 100 a = 100
x ˉ = a + ∑ f i d i ∑ f i = 100 + 140 50 = 100 + 2.8 = 102.8 \displaystyle \bar{x} = a + \dfrac{\sum f_i d_i}{\sum f_i} = 100 + \dfrac{140}{50} = 100 + 2.8 = 102.8 x ˉ = a + ∑ f i ∑ f i d i = 100 + 50 140 = 100 + 2.8 = 102.8
Answer: the mean use is 102.8 units.
Question 3#
The monthly spending on snacks by 50 students is given. Find the mean by the step-deviation method.
Solution. Class marks: 175, 225, 275, 325, 375, 425. Take a = 275 a = 275 a = 275 h = 50 h = 50 h = 50 u i = − 2 , − 1 , 0 , 1 , 2 , 3 u_i = -2, -1, 0, 1, 2, 3 u i = − 2 , − 1 , 0 , 1 , 2 , 3
∑ f i u i = 4 ( − 2 ) + 9 ( − 1 ) + 15 ( 0 ) + 11 ( 1 ) + 7 ( 2 ) + 4 ( 3 ) = − 8 − 9 + 0 + 11 + 14 + 12 = 20 x ˉ = 275 + 50 × 20 50 = 275 + 20 = 295 \displaystyle \begin{aligned} \sum f_i u_i &= 4(-2) + 9(-1) + 15(0) + 11(1) + 7(2) + 4(3) \\ &= -8 - 9 + 0 + 11 + 14 + 12 = 20 \\ \bar{x} &= 275 + 50 \times \dfrac{20}{50} = 275 + 20 = 295 \end{aligned} ∑ f i u i x ˉ = 4 ( − 2 ) + 9 ( − 1 ) + 15 ( 0 ) + 11 ( 1 ) + 7 ( 2 ) + 4 ( 3 ) = − 8 − 9 + 0 + 11 + 14 + 12 = 20 = 275 + 50 × 50 20 = 275 + 20 = 295
Answer: the mean spending is ₹295.
Why this works: all the classes are 50 wide, so dividing every deviation by 50 gives whole numbers and does not change the mean once we multiply back by h h h
Question 4#
The mean of the distribution below is 23.5. Find p p p
Solution. Class marks: 5, 15, 25, 35, 45.
∑ f i = 32 + p ∑ f i x i = 35 + 165 + 25 p + 315 + 225 = 740 + 25 p 740 + 25 p 32 + p = 23.5 740 + 25 p = 752 + 23.5 p 1.5 p = 12 p = 8 \displaystyle \begin{aligned} \sum f_i &= 32 + p \\ \sum f_i x_i &= 35 + 165 + 25p + 315 + 225 = 740 + 25p \\ \dfrac{740 + 25p}{32 + p} &= 23.5 \\ 740 + 25p &= 752 + 23.5p \\ 1.5p &= 12 \\ p &= 8 \end{aligned} ∑ f i ∑ f i x i 32 + p 740 + 25 p 740 + 25 p 1.5 p p = 32 + p = 35 + 165 + 25 p + 315 + 225 = 740 + 25 p = 23.5 = 752 + 23.5 p = 12 = 8
Check: 740 + 200 40 = 940 40 = 23.5 \displaystyle \frac{740 + 200}{40} = \frac{940}{40} = 23.5 40 740 + 200 = 40 940 = 23.5
Answer: p = 8 p = 8 p = 8
Question 5#
The distribution below has 30 observations and a mean of 34. Find a a a b b b
Solution. From the total, 4 + a + 10 + b + 3 = 30 4 + a + 10 + b + 3 = 30 4 + a + 10 + b + 3 = 30 a + b = 13 a + b = 13 a + b = 13
With class marks 15, 25, 35, 45, 55:
60 + 25 a + 350 + 45 b + 165 = 34 × 30 575 + 25 a + 45 b = 1020 25 a + 45 b = 445 5 a + 9 b = 89 \begin{aligned} 60 + 25a + 350 + 45b + 165 &= 34 \times 30 \\ 575 + 25a + 45b &= 1020 \\ 25a + 45b &= 445 \\ 5a + 9b &= 89 \end{aligned} 60 + 25 a + 350 + 45 b + 165 575 + 25 a + 45 b 25 a + 45 b 5 a + 9 b = 34 × 30 = 1020 = 445 = 89
Substituting a = 13 − b a = 13 - b a = 13 − b 65 − 5 b + 9 b = 89 65 - 5b + 9b = 89 65 − 5 b + 9 b = 89 4 b = 24 4b = 24 4 b = 24 b = 6 b = 6 b = 6 a = 7 a = 7 a = 7
Check: 60 + 175 + 350 + 270 + 165 = 1020 60 + 175 + 350 + 270 + 165 = 1020 60 + 175 + 350 + 270 + 165 = 1020 1020 30 = 34 \displaystyle \frac{1020}{30} = 34 30 1020 = 34
Answer: a = 7 a = 7 a = 7 b = 6 b = 6 b = 6
Mode of grouped data#
Question 6#
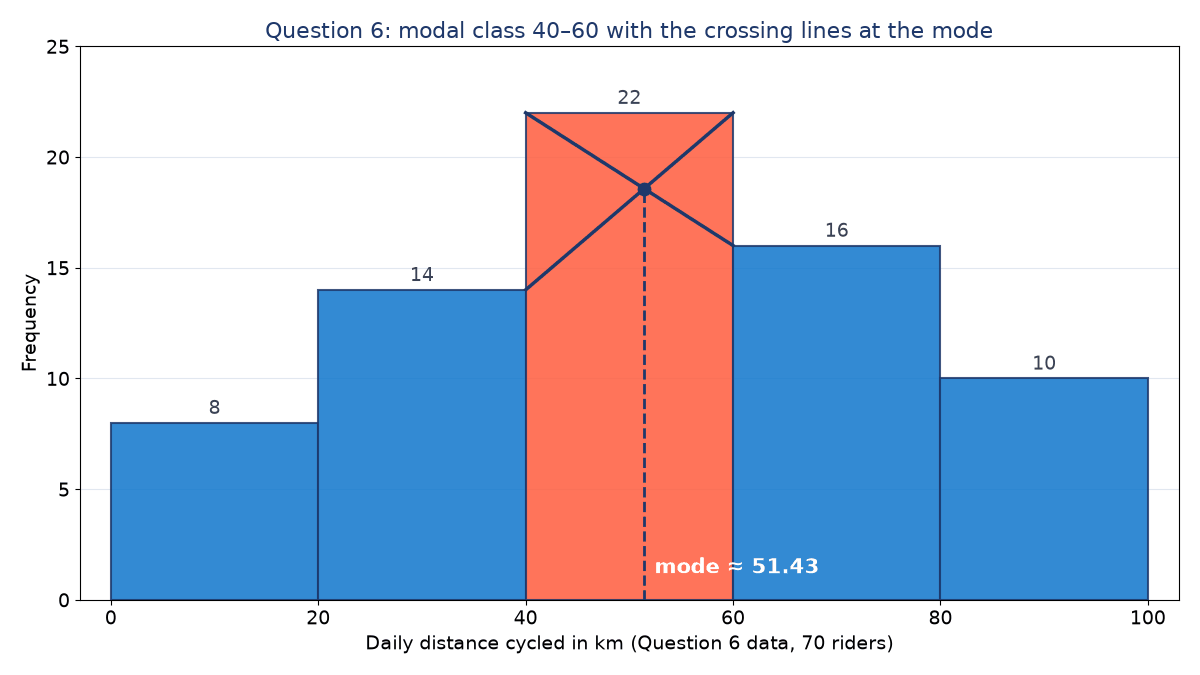
The daily distance cycled by 70 riders is shown. Find the modal distance.
Solution. The highest frequency is 22, so the modal class is 40–60: l = 40 l = 40 l = 40 h = 20 h = 20 h = 20 f 1 = 22 f_1 = 22 f 1 = 22 f 0 = 14 f_0 = 14 f 0 = 14 f 2 = 16 f_2 = 16 f 2 = 16
Mode = 40 + 22 − 14 44 − 14 − 16 × 20 = 40 + 8 14 × 20 = 40 + 160 14 ≈ 40 + 11.43 = 51.43 \displaystyle \begin{aligned} \text{Mode} &= 40 + \dfrac{22 - 14}{44 - 14 - 16} \times 20 \\ &= 40 + \dfrac{8}{14} \times 20 = 40 + \dfrac{160}{14} \approx 40 + 11.43 = 51.43 \end{aligned} Mode = 40 + 44 − 14 − 16 22 − 14 × 20 = 40 + 14 8 × 20 = 40 + 14 160 ≈ 40 + 11.43 = 51.43
Answer: the modal distance is about 51.43 km.
Question 6: the lines drawn inside the modal bar cross above 51.43 km. Question 7#
Find the mode of the distribution below.
Solution. The modal class is the last class, 30–40. There is no class after it, so f 2 = 0 f_2 = 0 f 2 = 0 l = 30 l = 30 l = 30 h = 10 h = 10 h = 10 f 1 = 11 f_1 = 11 f 1 = 11 f 0 = 8 f_0 = 8 f 0 = 8
Mode = 30 + 11 − 8 22 − 8 − 0 × 10 = 30 + 30 14 ≈ 30 + 2.14 = 32.14 \displaystyle \text{Mode} = 30 + \dfrac{11 - 8}{22 - 8 - 0} \times 10 = 30 + \dfrac{30}{14} \approx 30 + 2.14 = 32.14 Mode = 30 + 22 − 8 − 0 11 − 8 × 10 = 30 + 14 30 ≈ 30 + 2.14 = 32.14
Answer: the mode is about 32.14.
Why this works: a missing neighbour contributes a frequency of zero.
Question 8#
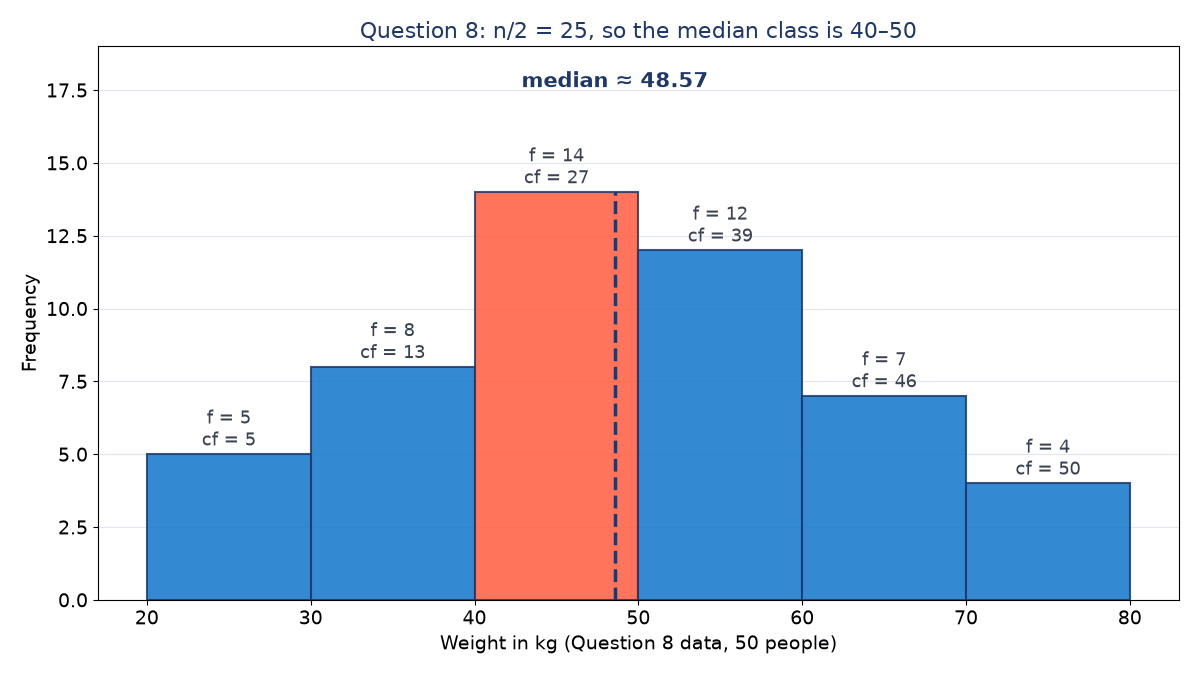
The weights of 50 people are shown. Find the median weight.
Solution. The cumulative frequencies are 5, 13, 27, 39, 46, 50. Here n = 50 n = 50 n = 50 n 2 = 25 \displaystyle \frac{n}{2} = 25 2 n = 25 c f cf c f l = 40 l = 40 l = 40 c f = 13 cf = 13 c f = 13 f = 14 f = 14 f = 14 h = 10 h = 10 h = 10
Median = 40 + 25 − 13 14 × 10 = 40 + 120 14 ≈ 40 + 8.57 = 48.57 \displaystyle \text{Median} = 40 + \dfrac{25 - 13}{14} \times 10 = 40 + \dfrac{120}{14} \approx 40 + 8.57 = 48.57 Median = 40 + 14 25 − 13 × 10 = 40 + 14 120 ≈ 40 + 8.57 = 48.57
Answer: the median weight is about 48.57 kg.
Question 8: the cumulative frequency first reaches 25 in the class 40 to 50. Question 9#
The scores of 50 players in a game are given. Find the median score.
Solution. The classes are inclusive. Half the gap is 40 − 39 2 = 0.5 \displaystyle \frac{40 - 39}{2} = 0.5 2 40 − 39 = 0.5
The cumulative frequencies are 4, 15, 31, 44, 50. n 2 = 25 \displaystyle \frac{n}{2} = 25 2 n = 25 l = 49.5 l = 49.5 l = 49.5 c f = 15 cf = 15 c f = 15 f = 16 f = 16 f = 16 h = 10 h = 10 h = 10
Median = 49.5 + 25 − 15 16 × 10 = 49.5 + 6.25 = 55.75 \displaystyle \text{Median} = 49.5 + \dfrac{25 - 15}{16} \times 10 = 49.5 + 6.25 = 55.75 Median = 49.5 + 16 25 − 15 × 10 = 49.5 + 6.25 = 55.75
Answer: the median score is 55.75.
Question 10#
The median of the distribution below is 22.5 and the total frequency is 40. Find x x x y y y
Solution. The median 22.5 lies in 20–30, so this is the median class: l = 20 l = 20 l = 20 f = 12 f = 12 f = 12 h = 10 h = 10 h = 10 n 2 = 20 \displaystyle \frac{n}{2} = 20 2 n = 20 c f = 6 + x cf = 6 + x c f = 6 + x
20 + 20 − ( 6 + x ) 12 × 10 = 22.5 ( 14 − x ) × 10 12 = 2.5 14 − x = 3 x = 11 \displaystyle \begin{aligned} 20 + \dfrac{20 - (6 + x)}{12} \times 10 &= 22.5 \\ \dfrac{(14 - x) \times 10}{12} &= 2.5 \\ 14 - x &= 3 \\ x &= 11 \end{aligned} 20 + 12 20 − ( 6 + x ) × 10 12 ( 14 − x ) × 10 14 − x x = 22.5 = 2.5 = 3 = 11
From the total: 6 + 11 + 12 + y + 5 = 40 6 + 11 + 12 + y + 5 = 40 6 + 11 + 12 + y + 5 = 40 y = 6 y = 6 y = 6
Check: the cumulative frequencies are 6, 17, 29, 35, 40; the first to reach 20 is 29, in 20–30, and 20 + 3 12 × 10 = 22.5 \displaystyle 20 + \frac{3}{12} \times 10 = 22.5 20 + 12 3 × 10 = 22.5
Answer: x = 11 x = 11 x = 11 y = 6 y = 6 y = 6
Empirical relation and exam-level questions#
Question 11#
For a distribution, the mode is 44 and the mean is 47. Use the empirical relationship to find the median.
Solution.
3 Median = Mode + 2 Mean = 44 + 2 ( 47 ) = 138 Median = 138 3 = 46 \displaystyle \begin{aligned} 3\,\text{Median} &= \text{Mode} + 2\,\text{Mean} = 44 + 2(47) = 138 \\ \text{Median} &= \dfrac{138}{3} = 46 \end{aligned} 3 Median Median = Mode + 2 Mean = 44 + 2 ( 47 ) = 138 = 3 138 = 46
Answer: the median is about 46.
Why this works: the median of a moderately lopsided distribution usually lies between the mode and the mean, about two-thirds of the way from the mode to the mean.
Question 12#
The marks of 50 students are given. Find the mean, median and mode, and check the empirical relationship.
Solution. The working columns are included in the table.
Mean:
x ˉ = 1500 50 = 30 \displaystyle \bar{x} = \dfrac{1500}{50} = 30 x ˉ = 50 1500 = 30
Median: n 2 = 25 \displaystyle \frac{n}{2} = 25 2 n = 25 c f cf c f l = 30 l = 30 l = 30 c f = 24 cf = 24 c f = 24 f = 15 f = 15 f = 15 h = 10 h = 10 h = 10
Median = 30 + 25 − 24 15 × 10 = 30 + 2 3 ≈ 30.67 \displaystyle \text{Median} = 30 + \dfrac{25 - 24}{15} \times 10 = 30 + \dfrac{2}{3} \approx 30.67 Median = 30 + 15 25 − 24 × 10 = 30 + 3 2 ≈ 30.67
Mode: the modal class is also 30–40, with f 1 = 15 f_1 = 15 f 1 = 15 f 0 = 12 f_0 = 12 f 0 = 12 f 2 = 7 f_2 = 7 f 2 = 7
Mode = 30 + 15 − 12 30 − 12 − 7 × 10 = 30 + 30 11 ≈ 32.73 \displaystyle \text{Mode} = 30 + \dfrac{15 - 12}{30 - 12 - 7} \times 10 = 30 + \dfrac{30}{11} \approx 32.73 Mode = 30 + 30 − 12 − 7 15 − 12 × 10 = 30 + 11 30 ≈ 32.73
Check:
3 Median = 3 × 92 3 = 92 Mode + 2 Mean ≈ 32.73 + 60 = 92.73 \displaystyle \begin{aligned} 3\,\text{Median} &= 3 \times \dfrac{92}{3} = 92 \\ \text{Mode} + 2\,\text{Mean} &\approx 32.73 + 60 = 92.73 \end{aligned} 3 Median Mode + 2 Mean = 3 × 3 92 = 92 ≈ 32.73 + 60 = 92.73
The two sides agree to within 1, so the relation holds approximately. It would estimate the mode as 92 − 60 = 32 92 - 60 = 32 92 − 60 = 32
Answer: mean = 30, median ≈ 30.67, mode ≈ 32.73; the empirical relation holds approximately.
Key terms#
Class mark The mid-point of a class interval.
Assumed mean A convenient central value from which deviations are measured.
Step deviation A deviation divided by the class size, u i = x i − a h \displaystyle u_i = \frac{x_i - a}{h} u i = h x i − a
Modal class The class with the highest frequency.
Cumulative frequency The running total of frequencies up to a class.
Median class The first class whose cumulative frequency is at least n 2 \displaystyle \frac{n}{2} 2 n
Class boundaries The limits of continuous classes made from inclusive classes by moving each limit half the gap.
Empirical relationship The approximate rule 3 Median = Mode + 2 Mean 3\,\text{Median} = \text{Mode} + 2\,\text{Mean} 3 Median = Mode + 2 Mean
Common questions#
Which mean method should I use if the question does not say?#
Any method earns full marks. Use step deviation for large class marks with equal widths, and the direct method when there is a missing frequency.
No. They often coincide, as in Question 12, but the modal class depends on the largest frequency while the median class depends on n 2 \displaystyle \frac{n}{2} 2 n
How do I check a missing frequency answer?#
Put the value back into the table, recompute the mean or median, and confirm that the class you assumed is still the median class or modal class.
Do I round in the middle of the working?#
Keep fractions such as 160 14 \displaystyle \frac{160}{14} 14 160
Is the ogive part of this chapter?#
No. The rationalised Class 10 syllabus finds the median from the formula, not from a cumulative frequency graph.
References#
National Council of Educational Research and Training. Mathematics: Textbook for Class X . NCERT, New Delhi.
Sharma, R. D. Mathematics for Class 10 . Dhanpat Rai Publications.
Aggarwal, R. S. Secondary School Mathematics for Class 10 . Bharati Bhawan.