Mean of Grouped Data Class 10: Three Methods Explained
Find the mean of grouped data by the direct, assumed mean and step-deviation methods, see why all three agree, solve missing-frequency problems and learn which method to pick in the Class 10 exam.
The mean is the everyday "average": add up all the values and divide by how many there are. When data comes as a frequency table with class intervals, such as marks, wages or heights grouped into ranges, we no longer know each separate value, so we need a way to estimate the mean from the table. This lesson covers the three methods used in Class 10: the direct method, the assumed mean method and the step-deviation method. All three give the same answer, and choosing well saves you a lot of arithmetic in the exam.
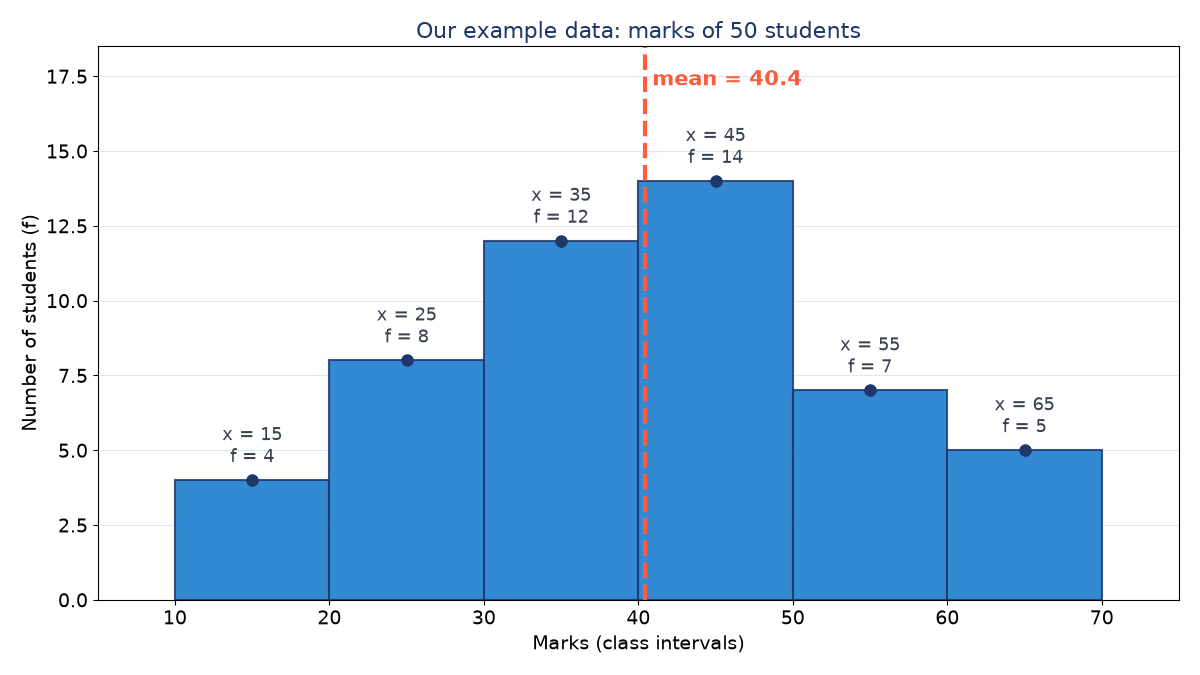
In a grouped frequency distribution, each row gives a class interval such as 20–30 and a frequency f, the number of observations that fall in that interval. The total of all frequencies is written ∑fi or n. With the usual convention, a value on a boundary (for example 30) is counted in the class that starts with it (30–40), not the one that ends with it.
Because we do not know exactly where each observation lies inside its class, we assume that every observation in a class sits at the middle of the class. That middle value is called the class mark (or mid-point):
xi=2lower limit+upper limit
For the class 20–30 the class mark is 220+30=25. The class size (or width) is h=upper limit−lower limit, so here h=10. This "centre" assumption is why the mean of grouped data is an estimate; it is usually very close to the true mean.
So the assumed mean formula is exactly the direct formula, whatever value of a you choose. Next, di=hui, so ∑fidi=h∑fiui, and substituting gives the step-deviation formula. The methods differ only in the size of the numbers you multiply, never in the answer.
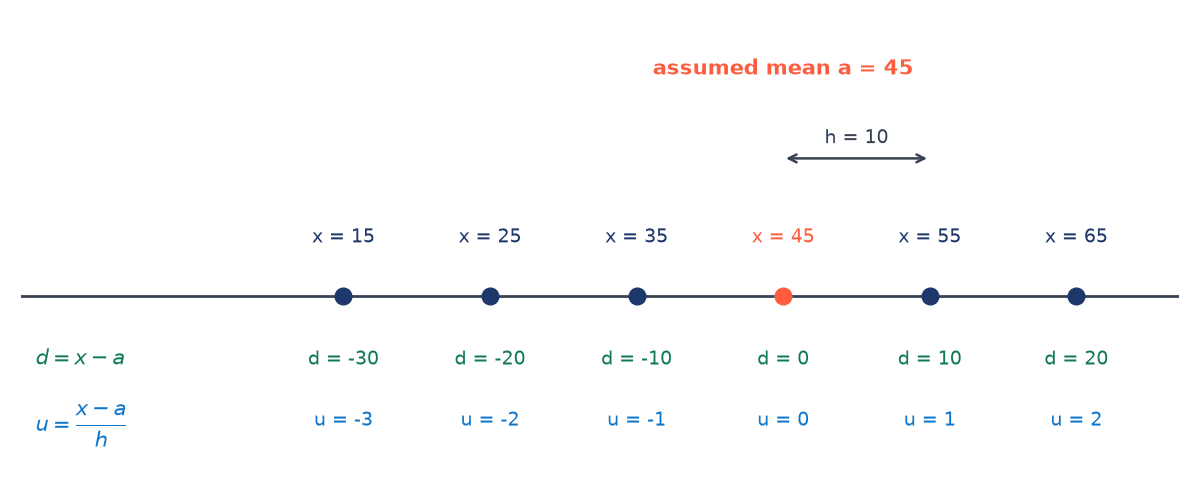
With a=45 and h=10, the class marks turn into deviations d and then into the small numbers u.
Direct method: when the class marks and frequencies are small, or when a question asks you to find a missing frequency (the algebra is simplest here).
Assumed mean method: when the class marks are large, or the class widths are not all equal.
Step-deviation method: when the class marks are large and all classes have the same width. It gives the smallest numbers and the fewest slips.
If a question names a method, you must use that method, even if another is quicker.
Does the choice of assumed mean change the answer?#
No. The proof above shows that a cancels out, so any value gives the same mean. A central class mark simply keeps the numbers small.
Why is the mean of grouped data only an estimate?#
Because each observation is replaced by its class mark. The real values inside a class may lean towards one end, so the true mean can differ slightly from the grouped mean.
Can the assumed mean be a value that is not a class mark?#
Yes, the formula works for any a. But if a is not a class mark, the ui will not be whole numbers, so a class mark is the sensible choice.
For the mean, the class mark is still the average of the limits, for example 210+19=14.5. You may convert to continuous classes first; the class marks do not change.
Step deviation for equal widths and large values, because it has the fewest large products. Always add a quick check that the mean lies near the tallest classes.