Cost of production is everything a firm spends to make and deliver its product. Here are fixed, variable, total and average costs, with worked tables and cost curves.
Costs of production (COP) refers to all the expenses incurred in the process of creating and delivering a product or service. These expenses can include raw materials, labour, equipment, rent, and marketing costs. In simple terms, it is the sum of all expenses necessary to produce and sell a product or service.
The costs of production are the costs that a company incurs when it produces goods or services, sells those goods or services, and delivers them to its customers.
Fixed costs(FC) are the costs that don’t change when production output changes.
A company has to pay fixed costs whether the output level increases or decreases. Fixed costs are also costs that a company incurs when the output level is zero. The higher the fixed costs are in a company, the higher the output must be for the business to break even.
Capital can be a fixed factor of production that can make a company incur consistent amounts of fixed costs in the short run.
Other examples of fixed costs include:
1. Maintenance costs of a factory or an office building.
Variable costs(VC) are the costs that change when production output changes.
Variable costs relate directly to the production or sale of a product. The marginal cost of an extra output unit determines the variable cost as more variable inputs are integrated into production. If a company increases its output in the short run, its total variable costs will rise.
If a firm increases the production of its products, which it also needs to package, its variable costs will rise. This is because the firm will require a higher amount of packaging for the increased production output.
Other examples of variable costs include:
1. Wages.
2. Basic raw materials (such as wood, metal, iron.)
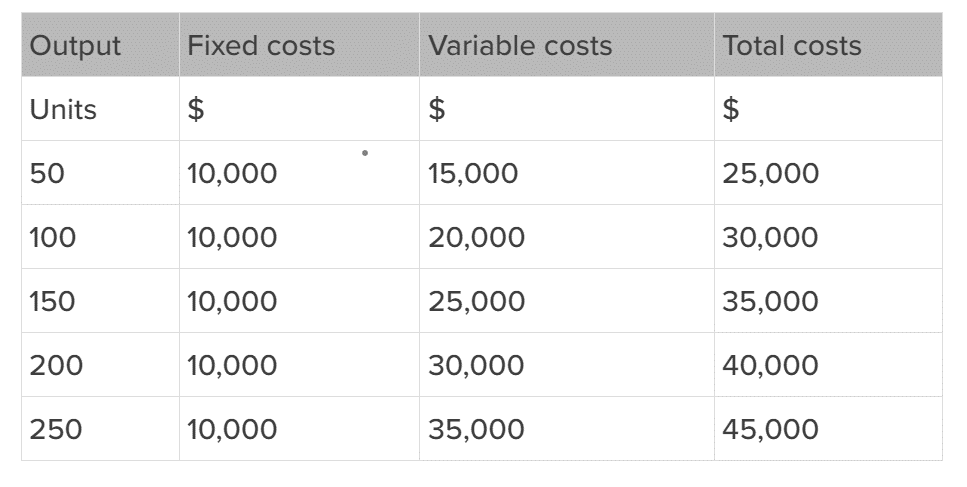
Consider this simple table to understand a basic cost overview and their calculation process.
In the table we can see, we have a certain set of units labelled as ‘Output’ as well as fixed costs and variable costs in dollars.
As we now know, fixed costs remain constant: at every level of output they are 10,000 dollars.
Variable costs, on the other hand, change as output changes.
To calculate the total costs of production we can follow the formula that we discussed above. We simply add the fixed and variable costs. The total cost at each output level is shown in the fourth column.
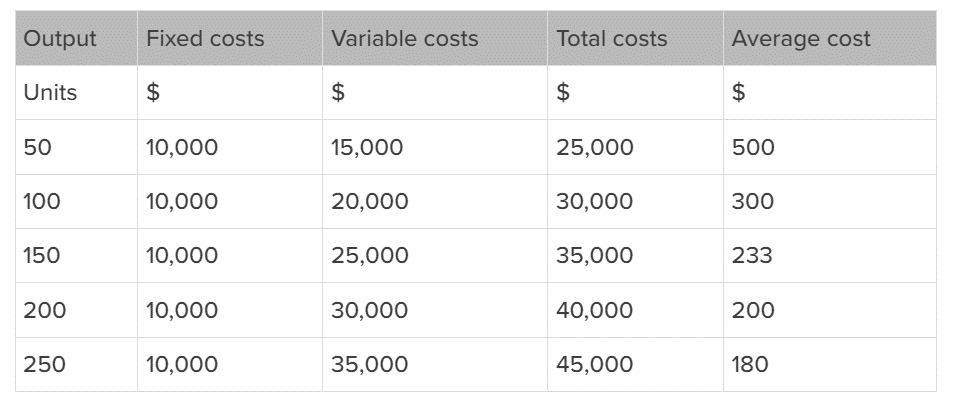
We calculate the average cost of production (also known as the unit cost) by dividing the firm’s total cost of production by the quantity of output it produces.
Average Cost (AC)=Total Costs (TC)/Level of Output (Q)
The table below works out the average cost at each output level:
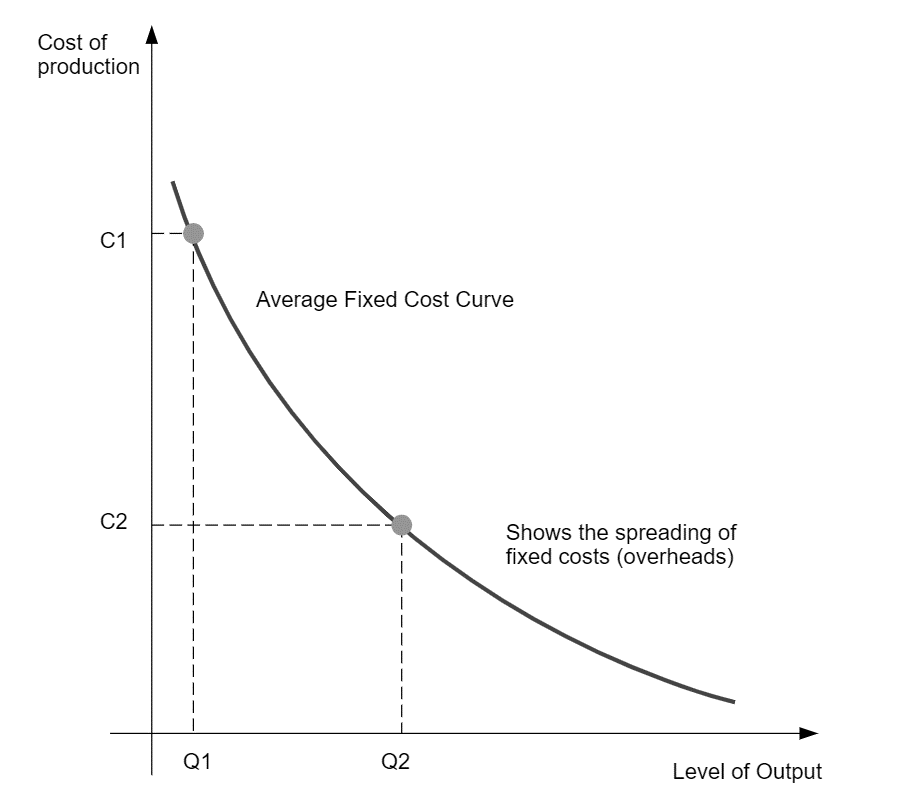
We can illustrate the average fixed costs for each output level on an average fixed cost curve as in the figure below.
As you can see in the figure, the average fixed cost is relatively high at C1 and a low output level at Q1. However, as the production of output of the company starts to increase from Q1 to Q2, the average cost gradually declines from C1 to C2. This is because the fixed costs are spread over an increasingly larger quantity of output.
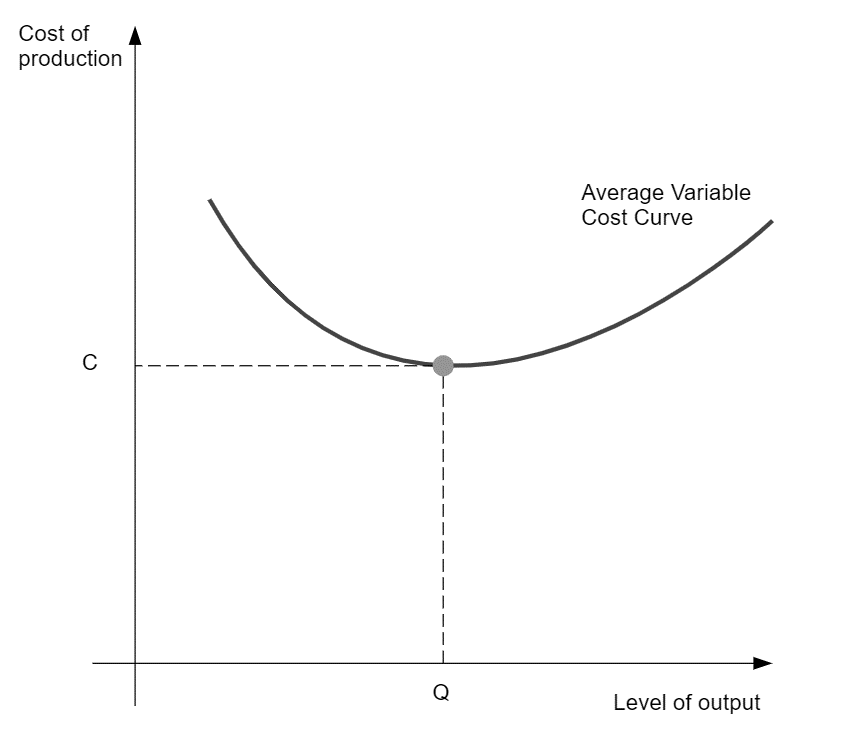
The average variable cost curve is a U-shaped curve that illustrates the relationship between the average variable cost incurred by a firm producing goods and services at a certain output level in the short run.
The figure below shows a firm's average variable cost curve.
Figure below shows a firm’s variable cost curve of the production of labour factor.
As you can see in the figure, labour becomes more productive as more workers are employed. Labour reaches its highest productivity, thereby minimising the average costs for the firm, at cost C and output level Q. However, if employment within the firm increased further, labour would eventually become less productive and the average cost would start rising again.
The average total cost curve illustrates the relationship between the average total cost incurred by a firm producing goods and services at a certain output level in the short run. The curve shows us the relation between the average total cost and output level while keeping production factors like technology and labour constant.
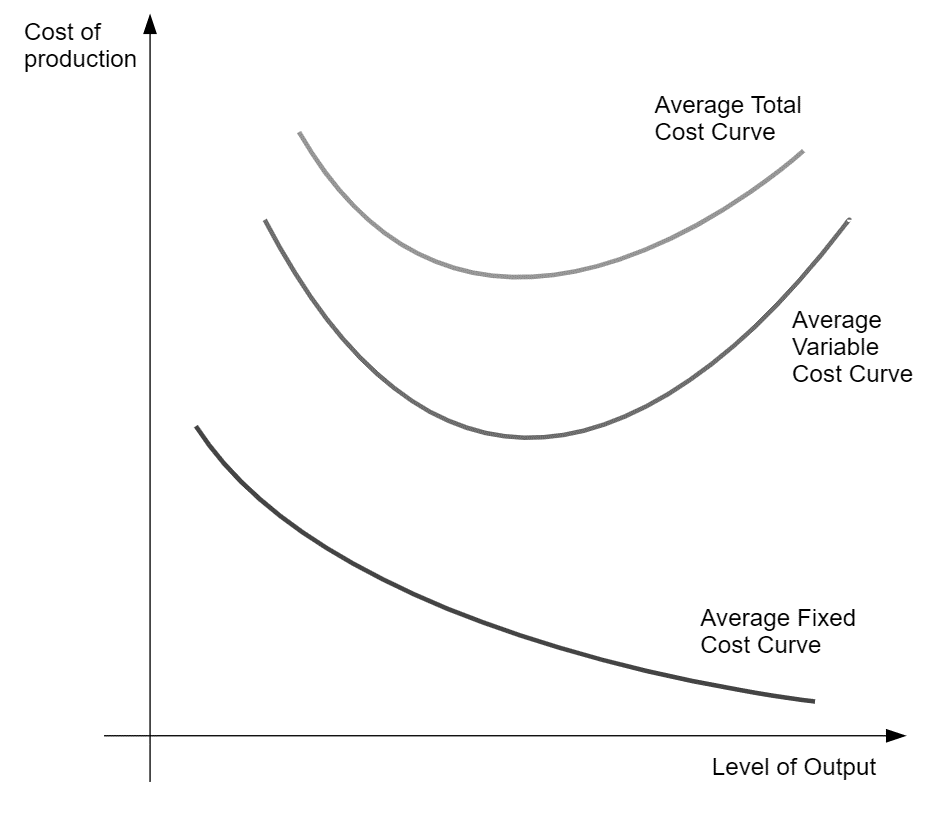
The average total cost curve is U-shaped and is usually illustrated alongside the average fixed cost curve and average variable cost curve.
The figure below shows the three curves together.
Figure below depicts the three curves alongside each other.
We obtain the average total cost curve by adding together the average fixed cost and the average variable cost at each output level.
These are the formulae:
Average Total Costs (ATC)=Average Fixed Costs (AFC)+Average Variable Costs (AVC)
Or
Average Total Costs (ATC)=Total Costs (TC)/Level of Output (Q)
The average total cost is high for small quantities of output, but as production increases, the average total cost starts to decline until it reaches a minimum value and then starts rising again.
The U-shape of the average total cost curve is a result of the underlying averages of both the average fixed and average variable costs. At low levels of output, both average fixed cost and average variable cost curves decline, which causes the average total cost curve to decline as well.
However, due to the law of diminishing marginal returns, the average variable cost curve eventually starts rising, outweighing the continued decline of the average fixed cost. This causes the average total cost to rise as well.
Costs of production refer to all the expenses incurred in the process of creating and delivering a product or service.
Fixed Cost (FC)
Fixed cost refers to a business expense that doesn't change even with an increase or decrease in the number of goods and services produced or sold.
Variable Cost (VC)
Variable costs are any expenses that change based on how much a company produces and sells, such as labor, utility expenses, commissions, and raw materials.
Average Cost (AC)
Average Cost equals the per-unit cost of production, which is calculated by dividing the total cost by the total output.
Average Total Cost (ATC)
Average total cost is referred to as the total of all production costs divided by the total quantity of output.
The unit cost of production is the total expenditure incurred by a company to produce, store, and sell one unit of a particular product.
Why do we need to calculate the cost of production?#
It helps firms estimate the revenues, profits, and losses that it has made. It also enables businesses to set the right prices for the products they sell.
How do production costs differ from manufacturing costs?#
Production cost refers to all of the expenses associated with a company conducting its business while manufacturing cost represents only the expenses necessary to make the product. Whereas production costs include both direct and indirect costs of operating a business, manufacturing costs reflect only direct costs.
For an expense to qualify as a production cost, it must be directly connected to generating revenue for the company. Manufacturers carry production costs related to the raw materials and labor needed to create their products. Service industries carry production costs related to the labor required to implement and deliver their service. Royalties owed by natural resource-extraction companies also are treated as production costs, as are taxes levied by the government.
Production incurs both direct costs and indirect costs. Direct costs for manufacturing an automobile, for example, would be materials like plastic and metal, as well as worker’s salaries. Indirect costs would include overhead such as rent and utility expenses. Total product costs can be determined by adding together the total direct materials and labor costs as well as the total manufacturing overhead costs. To determine the product cost per unit of product, divide this sum by the number of units manufactured in the period covered by those costs.