Market equilibrium is the price at which the quantity demanded equals the quantity supplied. See how excess demand and excess supply push a market back to it, and what shifts it.
A market is a place where buyers and sellers meet. When those buyers and sellers agree on what the price and quantity will be, and there’s no incentive to change the price or the quantity, the market is in equilibrium. In other words, market equilibrium is the point where the quantity demanded equals the quantity supplied.
Market equilibrium is one of the main fundamentals of the free market. Prominent economists have argued that the market will always go towards equilibrium regardless of the circumstances. Whenever there’s an external shock that might cause disturbance in the equilibrium, it is a matter of time before the market regulates itself and goes to the new equilibrium point.
Market equilibrium is most efficient in markets close to perfect competition. When a monopoly power exerts control over the prices, it prevents the market from reaching the equilibrium point. That’s because companies with monopoly power often set prices above the market equilibrium price, thereby harming consumers and economic welfare.
Market equilibrium is a vital tool to assess how efficient a particular market is. Additionally, it provides useful insights to analyse whether the price is at an optimal level and whether the stakeholders are harmed by a price that’s above the equilibrium point.
In industries where firms can exert their market power to raise prices, this prevents some people who demand the product from attaining it as the price is unaffordable. However, firms in this situation can still increase their prices above equilibrium as, usually, they face little to no competition.
The graph of market equilibrium provides useful insights into the dynamics of a market. Why do some economists argue that a market is destined to reach the equilibrium point in a free market setting?
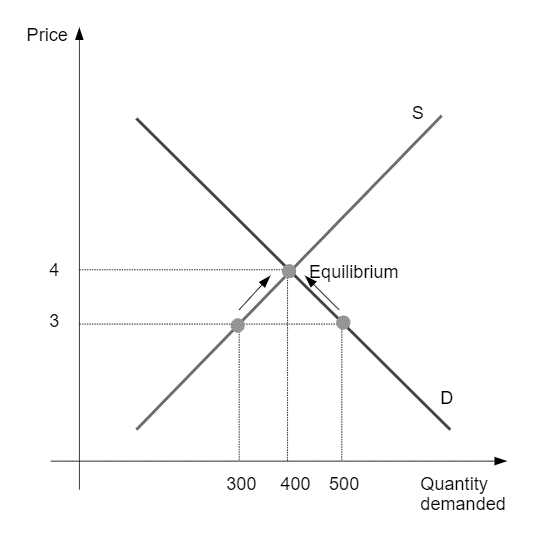
To understand how and why the market reaches the equilibrium point consider the first graph below. Suppose the free-market equilibrium, where supply and demand intersect, is at a price of ₹4.
Now suppose that goods are currently being traded at ₹3, which is ₹1 below the equilibrium price. At this point, you would have a firm willing to supply 300 units of goods, but consumers are willing to buy 500 units. In other words, there is excess demand for the good of 200 units.
The excess demand pushes the price up to ₹4. At ₹4, firms are willing to sell 400 units and buyers want to buy 400 units, so both sides are satisfied.
Excess demand occurs when the price is below equilibrium and the consumers are willing to buy more than the firms are prepared to supply.
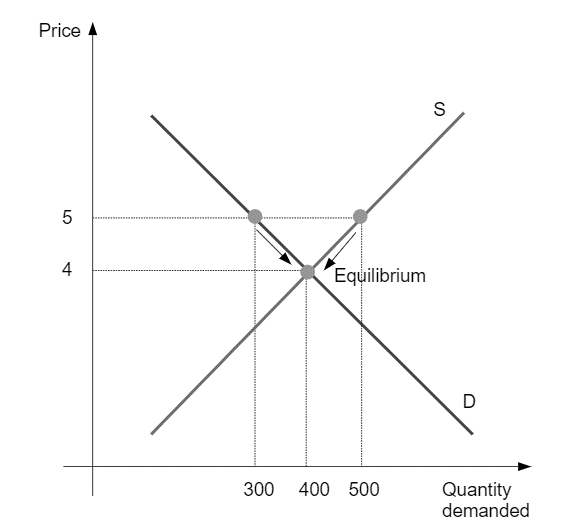
But what if goods are being traded at ₹5? The second graph shows this case, which is the opposite. Buyers now want only 300 units at ₹5, but sellers are willing to supply 500 units of goods at this price. In other words, there is an excess supply of 200 units on the market.
The excess supply pushes the price down to ₹4, and the market settles again at 400 units.
Excess supply occurs when the price is above equilibrium and the firms are prepared to supply more than the consumers are willing to buy.
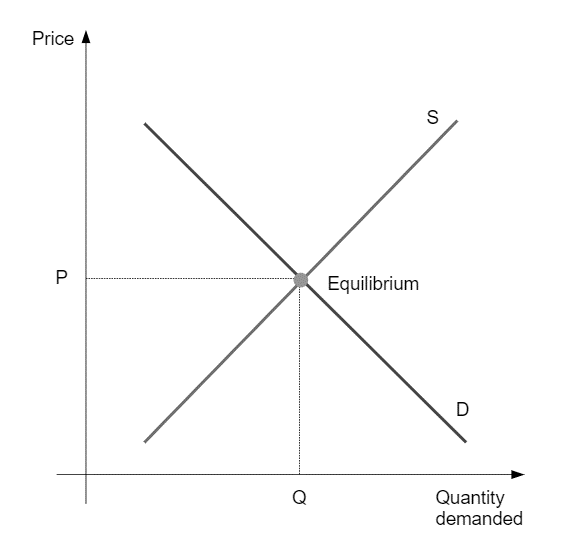
Due to the incentive provided by the dynamics of prices being above or below the equilibrium, the market will always have the tendency to move towards the equilibrium point. The graph below shows market equilibrium. At the equilibrium point both the demand curve and the supply curve intersect, creating what is known as equilibrium price P and equilibrium quantity Q.
One important thing to consider is that the equilibrium point is not static but subject to change. The equilibrium point can change when external factors cause a shift either in the supply or demand curve.
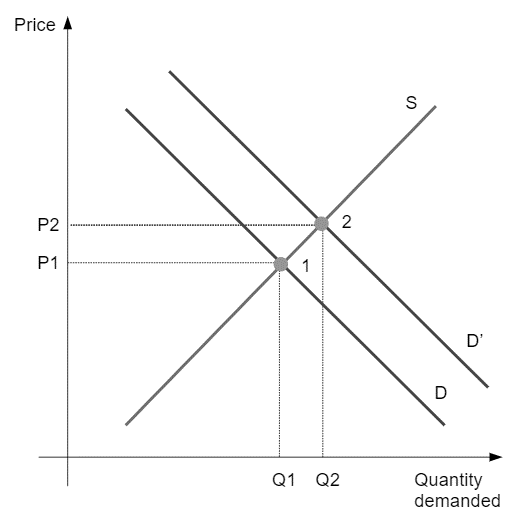
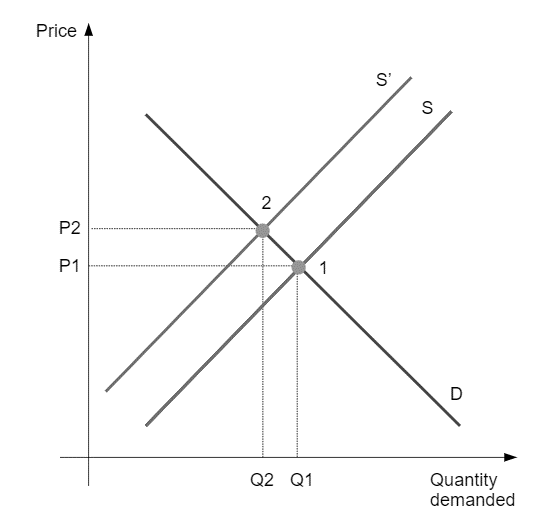
An outward shift in the demand curve would cause the market equilibrium to move from point 1 to point 2 at a higher price (P2) and quantity (Q2). The demand could shift either inwards or outwards. There are many reasons why the demand could shift:
A change in income. If an individual’s income increases, the demand for goods and services will also increase.
Taste change. If someone didn’t like sushi but started liking it, the demand for sushi would increase.
Price of substitute goods. When the price of a substitute rises, the demand for the good itself rises.
Price of complementary goods. As these goods are significantly linked, a price drop in one of the complementary goods would increase the demand for the other good.
In addition to demand shifts, you also have supply shifts that cause the market equilibrium to change. The graph above shows what happens to the equilibrium price and quantity when there’s a supply shift to the left. This would cause the equilibrium price to increase from P1 to P2, and the equilibrium quantity to decrease from Q1 to Q2. The market equilibrium will move from point 1 to point 2.
Many factors cause the supply curve to shift:
The number of sellers. If the number of sellers in the market increases, this would cause the supply to shift to the right, where you have lower prices and higher quantities.
Cost of input. If the cost of production inputs were to increase, it would cause the supply curve to shift leftwards. As a result, the equilibrium would occur at higher prices and lower quantities.
Technology. New technologies that would make the production process more efficient could increase supply, which would cause the equilibrium price to drop and the equilibrium quantity to increase.
The environment. Nature plays a vital role in many industries, especially agriculture. If there are no favourable weather conditions, the supply in agriculture would fall, causing an increase in equilibrium price and a decrease in equilibrium quantity.
Disequilibrium occurs when the market cannot reach the equilibrium point due to external or internal factors that act upon the equilibrium. When situations like this emerge, you would expect to see an imbalance between the quantity supplied, and the quantity demanded.
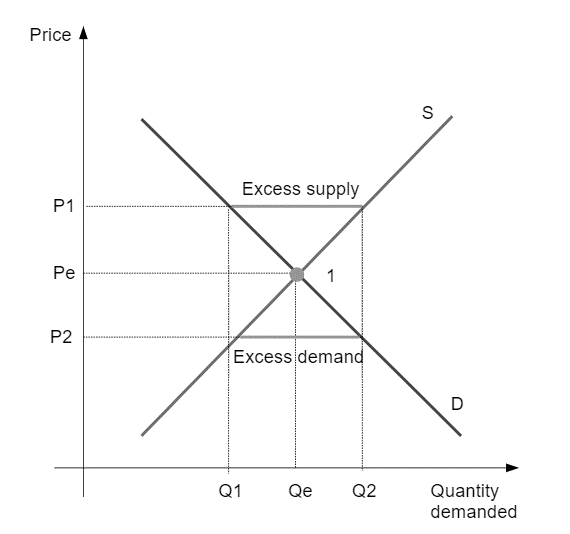
Consider the case of a fish market. The graph below illustrates the market for fish that is initially in equilibrium. At point 1, the supply curve for fish intersects the demand curve, which provides the equilibrium price and quantity in the market.
What would happen if the price was P1 instead of Pe? In that case, you would have fishermen wishing to supply much more than the number of people who want to buy fish. This is a market disequilibrium known as excess supply: sellers wanting to sell more than the demand for the good.
On the other hand, you would have less fish supplied when the price is below the equilibrium price but significantly more fish demanded. This is a market disequilibrium known as excess demand. Excess demand happens when the demand for the good or service is much higher than the supply.
The equilibrium price is the price at which demand matches supply, producing a market equilibrium acceptable to buyers and sellers. At the point where an upward-sloping supply curve and a downward-sloping demand curve intersect, supply and demand in terms of the quantity of the goods are balanced, leaving no surplus supply or unmet demand. The level of the market-clearing price depends on the shape and position of the respective supply and demand curves, which are influenced by numerous factors.