Supply is a fundamental economic concept. It is the quantity of a good or service that producers are willing and able to offer for sale at each price. Supply of a product tends to rise when its price goes up, because selling it becomes more profitable and firms expand production.
Supply is closely linked to demand, which is how much of a product people want to buy at a particular price at a particular time.
There are three key features of supply. These include:
- Quantity supplied: The amount of a good or service that producers are willing and able to offer for sale at a specific price.
- Time frame: The period over which the supply is measured. In the short term, the supply may be fixed due to factors such as limited production capacity. In the long term, producers can adjust their production levels.
- Price: The relationship between price and quantity supplied is direct, meaning that as the price of a good or service increases, the quantity supplied also increases, and vice versa.
A key part of understanding supply is knowing the law of supply. It states that, as the price of a good or service increases, suppliers will increase their supply so they can increase their profits.
Supply schedule and supply curve
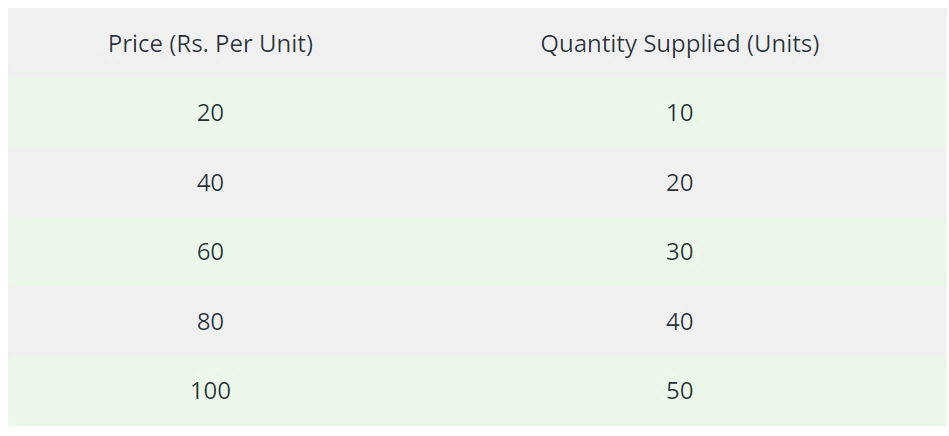
A supply schedule is a tabular representation of the various quantities of commodities that are supplied by a supplier at different price levels over a period of time.
Supply schedule shows the relationship between the price of goods and the quantity of goods supplied. It can also be said that supply schedule is a representation of the law of supply in a tabular form.
The law of supply states that with fall in the price of commodity, there will be a decrease in the supply and similarly, when the price of a commodity rises, it will result in an increase in the supply of goods in the market, keeping all the other factors constant.
Types of supply schedule
As with the demand schedule, there are two types of supply schedule:
- Individual supply schedule
- Market supply schedule
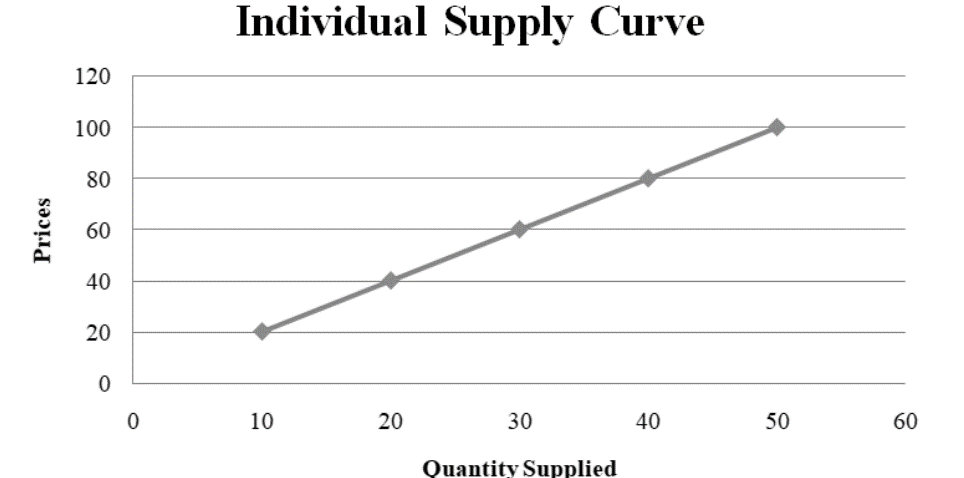
Individual Supply Schedule: Individual supply schedule is a tabular statement of the various quantities of product that is supplied by an individual or a firm at various price levels over a period of time, with all other factors being constant.
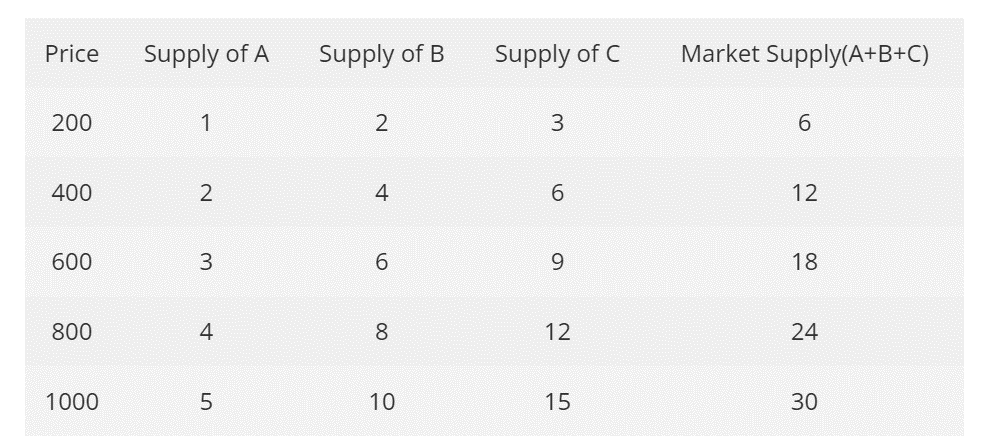
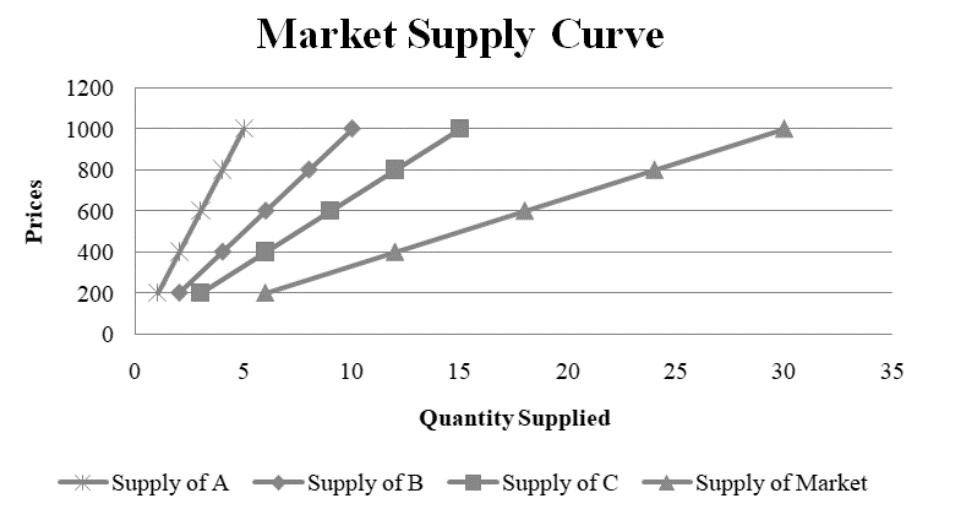
Market Supply Schedule: Market supply schedule is a tabular statement of the various quantities of the product that all the suppliers in the market are willing to supply at various price levels during a specific time period.
A market will be full of suppliers who will be supplying a particular commodity and all of these suppliers will be having their individual supply schedules. Therefore, the market supply schedule is a sum total of all the individual supply schedules of the suppliers of the market.
Market Supply Schedule can be represented as
Sm = SA + SB + …………….
Where Sm = Market Supply Schedule
SA = Individual Supplier A
SB = Individual Supplier B
Key terms
- Supply curve
- The supply curve is a graph of the relationship between the price of a good or service and the quantity supplied for a given period.
- Elasticity of Supply (ES)
- The price elasticity of supply is a measure of the degree of responsiveness of the quantity supplied to the change in the price of a given commodity.
- Marginal Cost (MC)
- In economics, the marginal cost is the change in total production cost that comes from making or producing one additional unit.
- Economies of Scale (EOS)
- The concept of economies of scale describes the relationship between the cost advantages received by a company and its rate of output (i.e. the volume of units produced and sold).
Common questions
What are the Exceptions of the Law of Supply?
There are some situations under which the law of supply of goods is not applicable. In these cases a higher price does not bring a larger supply. The exceptions are:
- Monopoly
- Closure of Business
- Perishable Goods
- Competition
- Agricultural Products
- Out of Fashion Goods
- Rare Goods
What is the formula for Law of Supply?
Qxs = Φ (Px)
Where:
- Qxs – Quantity supplied of commodity/good x by the producers
- Φ – Function of
- Px – Price of commodity/good x
What are the assumptions of law of supply?
- The price of other commodities is constant.
- The state of technology has not changed.
- The price of factors of production is constant.
- The taxation laws remain the same.
- The producer’s objectives are constant.
What are the four basic laws of supply and demand?
- If supply increases and demand stays the same, prices will fall.
- If supply remains constant and demand decreases, prices will fall.
- If supply decreases and demand stays the same, prices will rise.
- If supply remains constant and demand increases, prices will rise.