Quality is the degree to which a product or service meets its specifications and satisfies customer needs; in Joseph Juran's short phrase, it is fitness for use. Quality management is the coordinated set of activities (planning, control, assurance and improvement) that makes sure an organisation delivers that quality consistently and economically.
A customer buying a pen expects it to write smoothly, not leak, last a reasonable time and look acceptable. A company making lakhs of pens has to make sure that nearly every one meets that expectation, and the system it uses to do so is quality management. Poor quality leads to complaints, returns, scrap and lost sales; good quality builds trust, reduces waste and becomes a competitive advantage.
Why quality management matters
| If quality is poor | If quality is good |
|---|---|
| Customer complaints and returns rise | Customer satisfaction and loyalty improve |
| Reputation and goodwill fall | Brand image and trust grow |
| Scrap, rework and wastage increase | Waste and rework fall |
| Production cost and delays rise | Productivity improves because more output is good first time |
| Sales and employee morale suffer | Long-term profit and pride in work improve |
| Legal and warranty liabilities grow | The firm can compete on quality, not only on price |
The objective of quality management is to produce goods and services that meet specifications and satisfy customers at the lowest total cost. That means proper performance, consistency, reliability, few defects and cost control together. The practical aim is consistent quality delivered efficiently, not perfection at any price.
Defining quality
Several viewpoints
- User-based: quality is what the customer says it is; fitness for use.
- Manufacturing-based: quality is conformance to requirements (Philip Crosby's phrase), that is, meeting the specification.
- Product-based: quality is a measurable attribute, such as the thread count of a shirt.
- Value-based: quality is performance at an acceptable price.
A product can meet every internal specification and still disappoint customers. A restaurant may serve food quickly, but if taste and hygiene are poor, customers call it low quality. Quality management must therefore look both at specifications and at customer expectations.
Quality in products and services
For products, quality covers performance, size, durability, appearance, design and freedom from defects: a mobile phone should work properly, look good and not fail often. For services, it covers speed, accuracy, courtesy, reliability, responsiveness and the overall experience: in a hospital, correct treatment, cleanliness, quick response and proper patient care.
Garvin's eight dimensions of quality
David Garvin of Harvard Business School proposed that product quality has eight dimensions. A product can be strong on some and weak on others.
| Dimension | Meaning | Example |
|---|---|---|
| Performance | How well the product does its main job | A fan moves enough air |
| Features | Extra characteristics, the "bells and whistles" | Several wash modes on a washing machine |
| Reliability | Probability of failure-free operation over a stated period | A refrigerator that runs for years without breakdown |
| Conformance | Degree to which it matches design specifications and standards | A bolt within its diameter tolerance |
| Durability | How long it lasts before it wears out | Shoes that last three years |
| Serviceability | Ease, speed and courtesy of repair | A local service centre fixes a scooter in a day |
| Aesthetics | Look, feel, sound, colour, packaging | An attractive, well-finished phone |
| Perceived quality | Quality inferred from brand, reputation and advertising | Trusting a well-known brand of medicine |
Reliability matters most for medical equipment, vehicles, electronics and machinery, where failure is costly or dangerous. Aesthetics shapes first impressions and acceptance. Quality is therefore both functional and experiential.
Service quality dimensions
For services, the widely taught SERVQUAL model uses five dimensions: tangibles (facilities and appearance), reliability (doing what was promised, accurately), responsiveness (willingness to help promptly), assurance (knowledge and courtesy that inspire trust) and empathy (individual care and attention).
Elements of quality management
Quality management is a complete system, not just inspection. Juran described it as a trilogy of planning, control and improvement; assurance is usually added as a fourth element.
Quality planning
Deciding in advance who the customers are, what they need, what quality level and standards are required, and how the process will achieve them.
Quality control
Checking whether actual output meets the required standard and correcting deviations. It includes inspection, testing and statistical process control, and maintains the desired level of quality.
Quality assurance
Planned and systematic activities that give confidence that the system is capable of producing quality consistently, such as documented procedures, audits, supplier approval and certification. Quality control finds problems in the output; quality assurance prevents them in the process.
Quality improvement
Continuously raising performance by removing the causes of defects, using tools such as PDCA, Six Sigma projects and employee suggestion schemes.
| Basis | Inspection | Quality control | Quality management |
|---|---|---|---|
| Focus | Sorting good from bad items | Keeping the process to standard | The whole system, including prevention and improvement |
| Timing | After or during production | During production | From design to after-sales |
| Responsibility | Inspectors | Quality department and operators | Everyone, led by top management |
| Orientation | Detection | Detection and correction | Prevention |
Evolution of quality management
- Inspection: finished goods are checked and defective ones removed.
- Statistical quality control: Walter Shewhart's control charts in the 1920s and 1930s monitored process variation, and acceptance sampling reduced inspection cost.
- Quality assurance: the focus moved to preventing defects through systems, procedures and design.
- Total quality management (TQM): quality becomes a company-wide strategy built on customer focus, continuous improvement and employee involvement, strongly influenced by W. Edwards Deming, Joseph Juran and Japanese practice after the Second World War.
Total quality management and its tools
Principles of TQM
- Customer focus: quality is defined by internal and external customers.
- Continuous improvement (kaizen): small, ongoing gains in every process.
- Employee empowerment: workers are trained and allowed to solve problems, for example through quality circles.
- Management commitment: leaders set the policy and provide resources.
- Process approach and fact-based decisions: decisions rest on data, not opinion.
- Supplier partnership: fewer, better suppliers who share quality goals.
The PDCA cycle
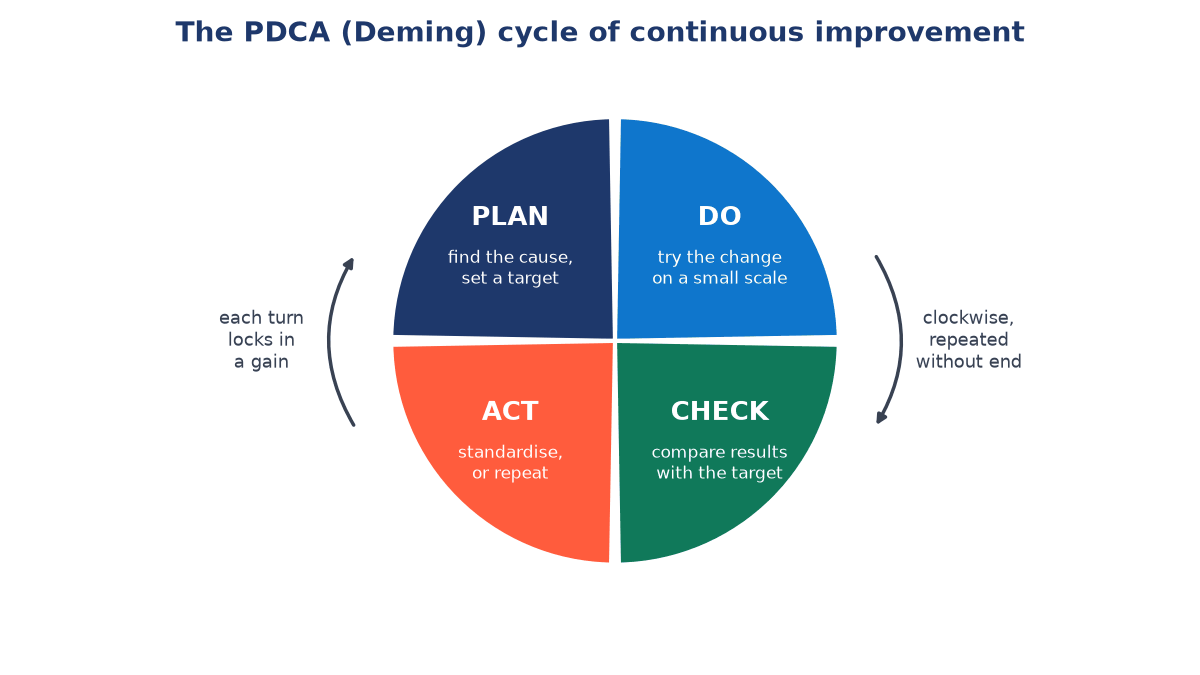
Deming popularised the Plan–Do–Check–Act cycle, which Shewhart had originated. The team plans a change after finding the cause of a problem, tries it on a small scale, checks the results against the target and then acts, either standardising the change or starting the cycle again.
Seven basic quality tools
- Check sheet: a simple form for tallying defects by type or location.
- Histogram: shows the distribution of a measurement.
- Pareto chart: ranks causes so the vital few that cause most defects are tackled first.
- Cause-and-effect (Ishikawa or fishbone) diagram: lists possible causes under headings such as man, machine, method, material, measurement and environment.
- Scatter diagram: shows the relationship between two variables.
- Flow chart: maps the steps of a process.
- Control chart: tracks a process over time against statistical limits; it is covered in the article on statistical quality control.
Other approaches
- Six Sigma: a data-driven method that aims for no more than 3.4 defects per million opportunities, using the DMAIC steps (Define, Measure, Analyse, Improve, Control).
- ISO 9001: an international standard for quality management systems; certification shows that documented, audited processes are in place.
- Poka-yoke (mistake-proofing): simple devices that make an error impossible or immediately visible.
- Benchmarking and quality function deployment (QFD), which translates customer needs into design requirements.
Quality gurus in brief
| Thinker | Main contribution |
|---|---|
| Walter A. Shewhart | Control charts; common and assignable causes of variation |
| W. Edwards Deming | 14 points for management; PDCA; reduce variation; quality is management's responsibility |
| Joseph M. Juran | Fitness for use; quality trilogy; Pareto principle applied to quality |
| Philip B. Crosby | Conformance to requirements; zero defects; "quality is free" |
| Kaoru Ishikawa | Cause-and-effect diagram; quality circles |
| Armand V. Feigenbaum | Total quality control across all departments |
| Genichi Taguchi | Quality loss function; robust design |
Cost of quality
Quality is not free to achieve. The cost of quality (COQ) is the total cost of preventing, detecting and correcting defects. It is usually divided into four categories.
Prevention costs
Costs of activities that stop defects from occurring: training, quality planning, process improvement, preventive maintenance, product design reviews and supplier development.
Appraisal costs
Costs of measuring, evaluating and auditing products or services: inspection, testing, test equipment, quality audits and calibration.
Internal failure costs
Costs of defects found before the product reaches the customer: scrap, rework, re-inspection, downtime and downgrading.
External failure costs
Costs of defects found after delivery: returns, warranty claims, replacements, complaint handling, product recalls, liability and lost goodwill.
Prevention and appraisal are the costs of conformance; internal and external failure are the costs of non-conformance. The central lesson is that prevention is usually cheaper than correction: each rupee spent on prevention can save several rupees of failure cost, and external failures are the most expensive because they also damage reputation.
Worked example: cost of quality
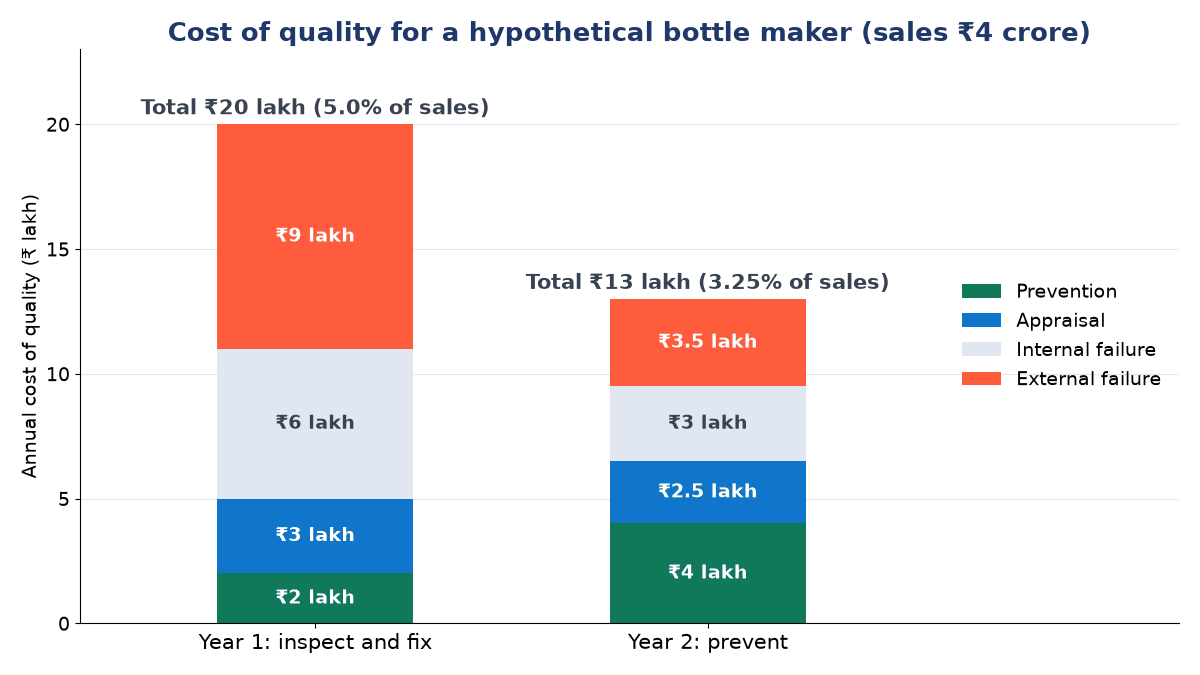
Suppose a plastic bottle maker (hypothetical figures) has annual sales of ₹4 crore (₹400 lakh). In Year 1 it relies on inspection and records the following quality costs. In Year 2 it doubles its spending on prevention (operator training, better mould maintenance and supplier checks).
| Category | Year 1 (₹ lakh) | Year 2 (₹ lakh) | Change (₹ lakh) |
|---|---|---|---|
| Prevention | 2.0 | 4.0 | +2.0 |
| Appraisal | 3.0 | 2.5 | −0.5 |
| Internal failure | 6.0 | 3.0 | −3.0 |
| External failure | 9.0 | 3.5 | −5.5 |
| Total COQ | 20.0 | 13.0 | −7.0 |
Step 1: total cost of quality.
Step 2: COQ as a percentage of sales.
Step 3: failure costs as a share of COQ.
Step 4: return on the extra prevention spending. An extra ₹2 lakh on prevention produced a net saving of ₹7 lakh in total quality cost. Failure costs alone fell by lakh, so each extra rupee on prevention cut failure costs by
This is the "prevention is cheaper than correction" principle in numbers.
Quality, operations and productivity
Quality management is at the core of operations, because operations produces the goods and services. When quality is out of control, material and machine time are wasted, schedules are disrupted and customers are let down. Quality links closely with production efficiency, inventory (defects need safety stock), maintenance (worn equipment makes defects), the supply chain (bad inputs make bad outputs) and customer service.
Good quality also raises productivity. Fewer defects mean less rework, fewer delays, less inspection effort and less wasted material and labour, so the same resources yield more acceptable output. This is why the belief that high quality always means high cost is only partly true: better prevention often lowers total cost, as the example shows.
Applications
Manufacturing
Raw material checks, process control, dimensional accuracy, final inspection, product reliability and defect reduction. A furniture factory, for instance, controls wood quality, cutting accuracy, finish, joint strength and final appearance.
Services
- hospital: accurate treatment, cleanliness, timeliness
- bank: correct transactions, speed, courteous handling
- college: teaching quality, administration, communication
- restaurant: food quality, hygiene, speed of service
Service quality depends heavily on consistency and the customer's experience at each point of contact.
Requirements for effective quality management
- clear, measurable quality standards
- visible commitment and support from top management
- training for all employees
- process control and reliable measurement with feedback
- employee involvement and teamwork
- supplier cooperation
- a culture of continuous improvement
Quality does not improve on its own; it has to be managed deliberately.
Key terms
- Quality
- The degree to which a product or service meets specifications and customer needs; fitness for use.
- Quality management
- The system of planning, controlling, assuring and improving quality across an organisation.
- Quality control
- Checking output against standards and correcting deviations to maintain the desired quality.
- Quality assurance
- Planned, systematic activities that give confidence that the process will produce quality consistently.
- Reliability
- The probability that a product will operate without failure for a stated period under stated conditions.
- Conformance
- The extent to which a product matches its design specifications.
- Cost of quality
- The total of prevention, appraisal, internal failure and external failure costs.
- Total quality management
- A company-wide approach built on customer focus, continuous improvement and employee involvement.
- PDCA cycle
- Plan, Do, Check, Act: a repeating cycle for continuous improvement.
- Six Sigma
- A data-driven approach aiming for no more than 3.4 defects per million opportunities.
Common questions
What is the difference between quality control and quality assurance?
Quality control checks the output and corrects defects that have occurred, so it is detection-oriented. Quality assurance builds procedures, audits and systems so that defects are prevented, so it is prevention-oriented.
What are Garvin's eight dimensions of quality?
Performance, features, reliability, conformance, durability, serviceability, aesthetics and perceived quality.
What are the components of the cost of quality?
Prevention costs (such as training), appraisal costs (such as inspection), internal failure costs (such as scrap and rework) and external failure costs (such as warranty claims and returns).
Why is external failure cost considered the worst?
Because the defect has reached the customer. Besides repair or replacement, the firm pays in complaints, lost goodwill and lost future sales, which are hard to measure and recover.
Does better quality always cost more?
Not necessarily. Higher design grade can cost more, but better conformance through prevention usually reduces scrap, rework and returns, so total cost often falls. In the example, total quality cost fell from ₹20 lakh to ₹13 lakh.
How is inspection different from quality management?
Inspection only sorts good items from bad after or during production. Quality management covers planning, prevention, control and improvement across the whole organisation, and inspection is just one small part of it.
References
- Deming, W. E. (1986) Out of the Crisis. MIT Press.
- Shewhart, W. A. (1931) Economic Control of Quality of Manufactured Product. D. Van Nostrand Company.
- Montgomery, D. C. Introduction to Statistical Quality Control. Wiley.
- Heizer, J., Render, B. and Munson, C. Operations Management: Sustainability and Supply Chain Management. Pearson.
- Slack, N., Brandon-Jones, A. and Burgess, N. Operations Management. Pearson.
- Bedi, K. Production and Operations Management. Oxford University Press.