The most popular value
The mode is simply the value that turns up most often, like the shoe size a shop sells the most of. With grouped data, though, the first thing you can see is only which class turns up most often. That class is called the modal class. In this lesson we use a formula that pins down the mode inside that class by comparing its frequency with the classes on either side. We'll also see what to do when the modal class sits at one end of the table.
Modal class
The modal class is the class with the highest frequency. Call its lower limit , its width and its frequency . The frequency of the class just before it is , and of the class just after it, .
The formula
Here's the idea behind it in plain words. The mode lives inside the modal class, but it gets tugged towards whichever neighbour is more crowded, and the fraction tells you how far along the class that tug takes it.
That fraction always lies between and , so the mode always lands inside the modal class. If your answer ends up outside the class, something went wrong when you substituted.
Worked examples
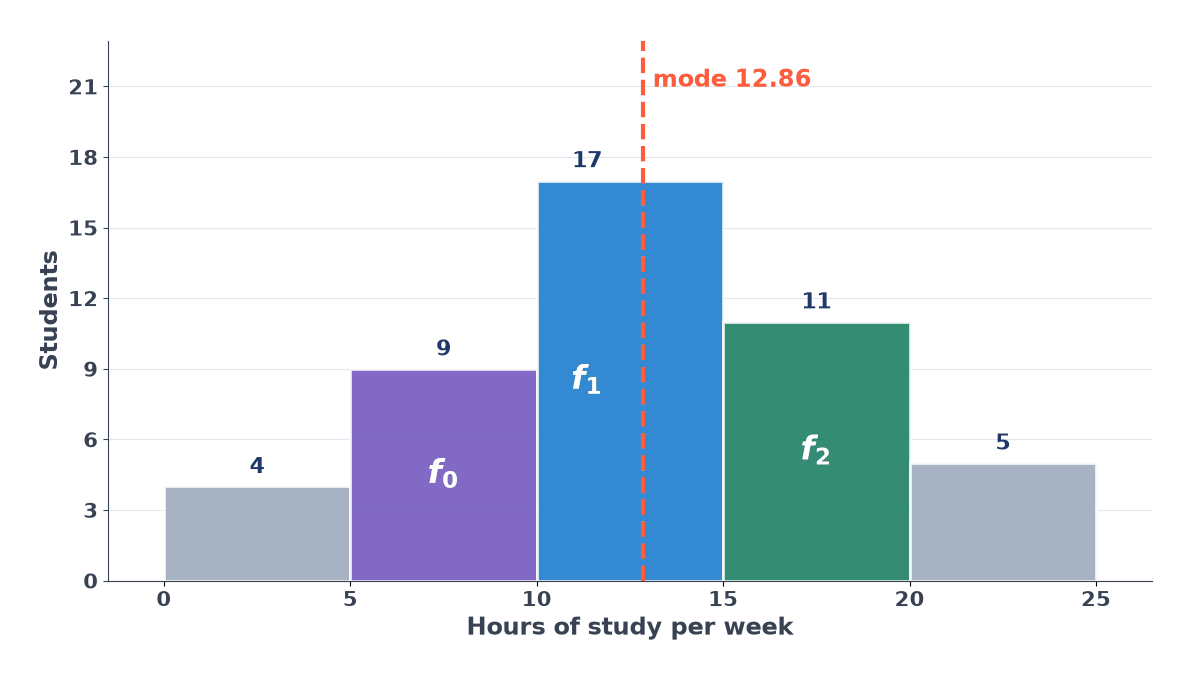
Example 1. Students were asked how many hours they study each week:
| Hours | – | – | – | – | – |
|---|---|---|---|---|---|
| Students |
The modal class is –, so , , , , .
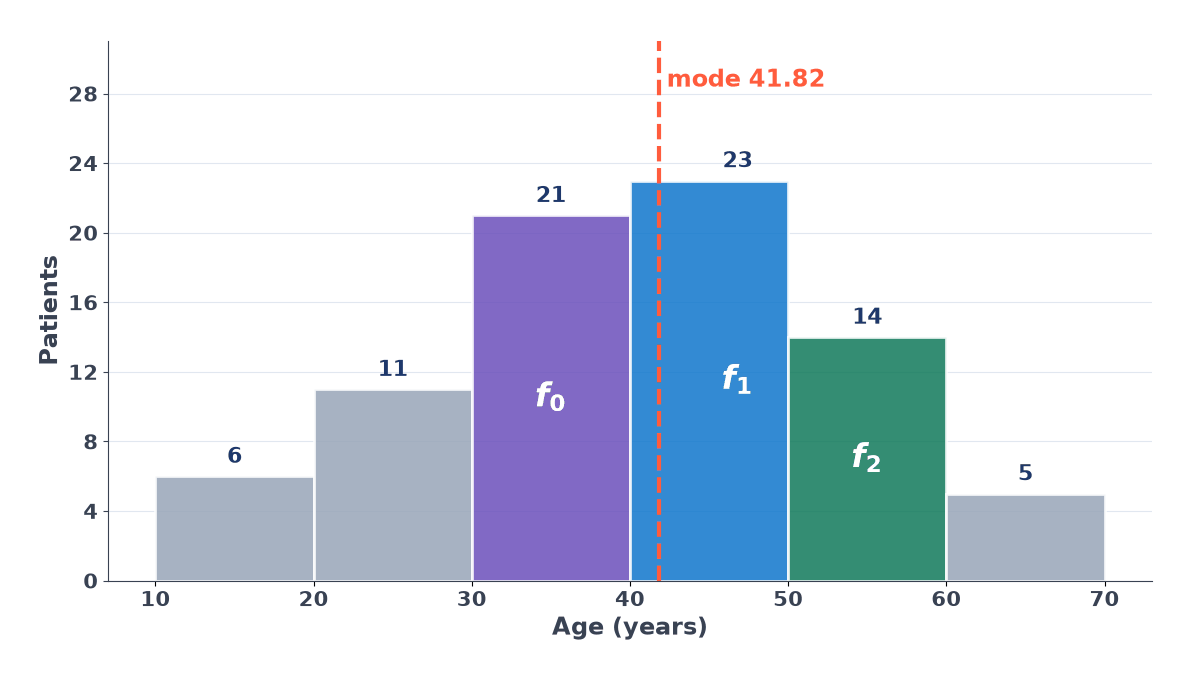
Example 2. The ages of patients seen at a clinic:
| Age | – | – | – | – | – | – |
|---|---|---|---|---|---|---|
| Patients |
The modal class is –, so , , , , .
See how close the mode is to ? The class before () is almost as crowded as the modal class (), so the mode gets pulled strongly towards the boundary between them.
Example 3. What if the modal class is the very first one?
| Class | – | – | – | – |
|---|---|---|---|---|
| Frequency |
Nothing comes before –, so we take .
In the same way, if the modal class is the last one, take .
Converting inclusive classes
Sometimes classes are written like –, –, –, with a gap of between them. The formula needs continuous classes, so close the gaps first: take off every lower limit and add to every upper limit, giving –, –, –. Now is the adjusted lower limit, and is still .
Example 4.
| Marks | – | – | – | – |
|---|---|---|---|---|
| Students |
The modal class is –, which becomes –, so .
Mean and mode together
The mean takes every value into account, while the mode only tells you the most common one. Go back to the study-hours data in Example 1. Its mean, by the direct method with class marks , is . That's very close to the mode of , because the distribution is nearly symmetric. When the mean and mode are far apart, it's a sign that the data is lopsided.
Practice
- Find the mode.
| Class | – | – | – | – | – |
|---|---|---|---|---|---|
| Frequency |
- Find the mode.
| Class | – | – | – | – | – |
|---|---|---|---|---|---|
| Frequency |
- Find the mode. Notice that the modal class is the last one.
| Class | – | – | – | – |
|---|---|---|---|---|
| Frequency |
- Change these to continuous classes, then find the mode.
| Class | – | – | – | – | – |
|---|---|---|---|---|---|
| Frequency |
Answers
Show answers
- .
- The modal class is –, so the mode is .
- Here , so the mode is .
- The classes become –, …, –, and the modal class is –. So the mode is .