Location analysis is the process of choosing the best place for a business facility, such as a factory, warehouse, retail store, hospital, college, restaurant or bank branch. It answers one question: where should the unit be set up so that it can work efficiently and profitably over many years?
The decision matters because it is expensive and slow to reverse. Once land is bought, buildings are put up and people are hired, moving is costly. A good site keeps transport and operating costs low and brings customers in; a poor site can hurt a well-run business for as long as it stays there. That is why textbooks treat location as a long-term strategic decision, not a routine one.
Why location is important
Location affects almost every cost and revenue line of a business. The effects of a good and a bad choice are summarised below.
| A good location can | A poor location can cause |
|---|---|
| Reduce inbound and outbound transport cost | High operating and transport cost |
| Attract more customers and increase sales | Poor customer response and low sales |
| Make raw materials easy to obtain | Delivery delays and supply interruptions |
| Improve availability of suitable labour | Difficulty in hiring and keeping workers |
| Support future expansion | Limited growth and low profitability |
For example, a retail store hidden in a side lane may have good products and still get few customers. The objective, therefore, is not simply the cheapest land. It is the best overall business advantage: low total cost, easy access, smooth operations, customer convenience and long-term benefit.
Levels of the location decision
Location is usually decided in stages, moving from the broad to the specific:
- Country – relevant for multinational firms.
- Region or state – influenced by markets, raw materials, incentives and labour.
- Community or city – influenced by infrastructure, services, attitudes and costs.
- Site – the exact plot, judged on size, access, cost, zoning and utilities.
Country selection in global decisions
When the choice is between countries, a firm studies political stability, the tax system, labour cost and productivity, trade rules and tariffs, infrastructure, currency risk and the legal environment. Cultural fit and closeness to target markets also matter.
Manufacturing versus service location
The best location depends on the type of business. The contrast between a cement factory and a supermarket shows this well. A cement plant wants to be near limestone, power supply and transport routes because its raw materials are heavy and costly to move. A supermarket wants to be near homes, main roads and parking because customers must reach it easily.
| Aspect | Manufacturing (factory) | Service or retail (shop, bank, hospital) |
|---|---|---|
| Main focus | Cost | Revenue and customer access |
| Key factors | Raw materials, transport, labour, land, electricity, water, government policy | Accessibility, visibility, foot traffic, parking, local demand, safety, nearby competition |
| Typical setting | Industrial area outside the city | Busy market or residential area |
| Typical methods | Factor rating, break-even, transport cost models | Factor rating, demand and purchasing-power analysis |
Factors affecting the location decision
Raw material availability
If raw materials are heavy, bulky or perishable, the firm usually locates near the source. Sugar mills are placed near sugarcane fields, paper mills near forests and cement plants near limestone deposits. This cuts transport cost and secures regular supply.
Nearness to market
Supermarkets, restaurants, hospitals, banks and courier offices need to be close to customers. Firms making perishable or quickly needed products also prefer market locations.
Transportation
A good site needs road, rail, port or airport links. Transport affects raw-material movement, delivery of finished goods, employee travel and customer access. For many manufacturers it is one of the strongest location factors.
Labour availability
The firm checks whether workers are available, whether they are skilled, what the wage levels are and whether the labour situation is stable. A textile unit, for instance, may choose an area with a pool of trained workers. Wage rates must be read together with productivity: cheap labour with low output may not reduce cost per unit.
Power, water and infrastructure
Reliable electricity, water, internet, drainage, waste disposal and nearby support services such as repair shops, banks and hospitals are essential.
Land and building cost
Land price, rent, construction cost and local taxes all raise fixed cost. An expensive site can still be worthwhile when sales are high; a showroom in a prime city area may pay high rent because of strong customer traffic.
Government policy
Governments influence location through tax benefits, subsidies, industrial zones and parks, pollution rules and labour laws. Firms study these legal and policy conditions before choosing.
Safety and environment
Hospitals need hygienic surroundings, schools need safe neighbourhoods and chemical factories must satisfy environmental rules. Community attitude towards the project also matters.
Scope for future expansion
A good site leaves room for more machines, more buildings or more service counters if demand rises. With no space to grow, the firm may have to relocate or split operations later.
Locational orientation
Different businesses are pulled towards different anchors:
- Near raw materials – when inputs are bulky, heavy, perishable or expensive to transport.
- Near the market – when products are perishable, needed quickly or depend on customer contact.
- Near labour – when labour skill or cost matters more than raw materials.
- Near a transport hub – when fast distribution is necessary.
Location choice is therefore not random; it follows from the nature of the business.
Steps in location analysis
- Identify the location need. Why is a new site required? Is it a factory, warehouse or store? Is it for expansion or a new business?
- Define the important factors. Decide what matters most: cost, market, transport, labour or raw materials, and how much each matters.
- Develop alternatives. Shortlist several feasible sites, for example Location A, B and C.
- Compare the alternatives. Study each site carefully using qualitative judgement and quantitative methods.
- Select the best location. Choose the site that gives the best total advantage, then confirm with a detailed site visit.
Methods of location analysis
Factor rating method
This is the most widely used method because it combines many factors, including ones that cannot be measured in rupees. The steps are:
- List the relevant factors.
- Give each factor a weight so that the weights add up to 1 (or 100).
- Score each location on each factor on a common scale, say 1 to 10.
- Multiply each score by the factor weight.
- Add the weighted scores for each location and choose the highest total.
Worked example: factor rating
Suppose a company is choosing between three sites and considers four factors: transport (weight 0.30), labour (0.20), market (0.25) and power (0.25). The weights total 1.00. Managers score each site out of 10.
| Factor | Weight | A score | A weighted | B score | B weighted | C score | C weighted |
|---|---|---|---|---|---|---|---|
| Transport | 0.30 | 7 | 2.10 | 9 | 2.70 | 6 | 1.80 |
| Labour | 0.20 | 8 | 1.60 | 7 | 1.40 | 9 | 1.80 |
| Market | 0.25 | 6 | 1.50 | 8 | 2.00 | 7 | 1.75 |
| Power | 0.25 | 9 | 2.25 | 7 | 1.75 | 8 | 2.00 |
| Total | 1.00 | 7.45 | 7.85 | 7.35 |
For Location B: . Location B has the highest total, so it is selected. Note that B does not win on every factor; C has better labour and A better power. The weights decide the result, which is why they must be set carefully and agreed before scoring.
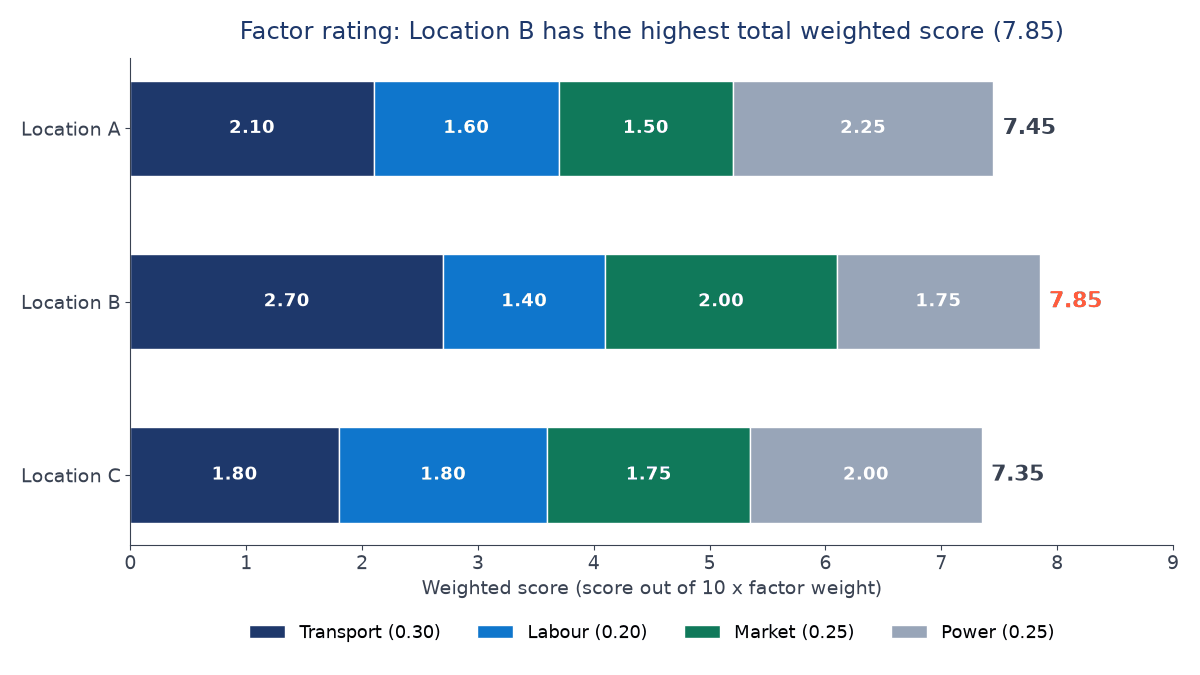
The method is useful because not all factors are equally important: transport may matter most for a factory, accessibility for a hospital and customer flow for a store. Its weakness is subjectivity, since both weights and scores reflect judgement.
Cost-volume analysis and break-even analysis
This method compares locations in economic terms. Each site has a fixed cost (land, building, equipment, taxes) and a variable cost per unit (labour, materials, transport, power). The total cost at volume is:
A site with high fixed cost but low variable cost becomes cheaper as volume rises; a site with low fixed cost but high variable cost suits small volumes. The volume at which two sites have equal total cost is found by setting their cost equations equal. Where revenue per unit is the same at every site, the cheapest site at the expected volume also gives the highest profit.
Crossover chart
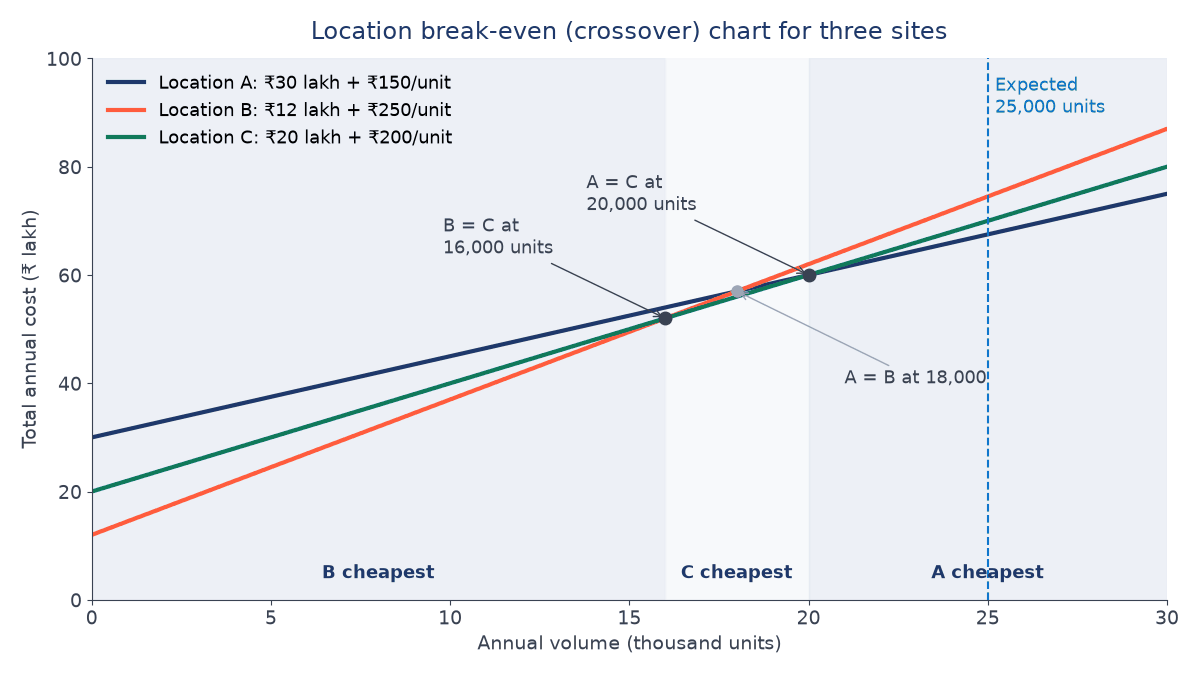
A crossover chart plots the total cost line of each location on one graph. The point where two lines meet is the crossover point: at that volume the two sites cost the same. Below it one site is better; above it the other is better. The chart makes the comparison easy to see.
Worked example: location break-even
Suppose a manufacturer has these hypothetical annual cost estimates and expects to make 25,000 units a year.
| Site | Fixed cost per year | Variable cost per unit |
|---|---|---|
| A | ₹30,00,000 | ₹150 |
| B | ₹12,00,000 | ₹250 |
| C | ₹20,00,000 | ₹200 |
Step 1: total cost at 25,000 units.
- A: = ₹67,50,000
- B: = ₹74,50,000
- C: = ₹70,00,000
Site A is cheapest at the expected volume.
Step 2: crossover points.
B and C: , so and units.
A and C: , so and units.
A and B: , so and units.
Step 3: decision ranges. Below 16,000 units B is cheapest; between 16,000 and 20,000 units C is cheapest; above 20,000 units A is cheapest. At 18,000 units A and B tie, but C is lower than both there, so that crossover does not change the choice. With expected volume of 25,000 units, choose Site A.
Other quantitative methods
- Centre-of-gravity method – finds a central point for a warehouse by weighting the map coordinates of the places it serves by the quantity shipped to each.
- Transportation model – a linear programming method that chooses the site giving the lowest total shipping cost across a network of plants and warehouses.
Location of warehouses and distribution centres
A warehouse or distribution centre is placed mainly to improve delivery speed, transport efficiency and customer service. The ideal site reduces overall distribution cost and lets the firm reach customers quickly. A courier company, for example, may set up its hub near highways and an airport.
Location versus layout
Students often confuse these two decisions.
| Location | Layout |
|---|---|
| Where the business should be set up | How machines, departments, counters or sections are arranged inside that site |
| An outside decision | An inside arrangement |
| Taken rarely; very costly to change | Revised more often as products and volumes change |
A simple retail illustration
Suppose someone wants to open a supermarket and compares three places. Place A has low rent but is far from customers. Place B has high rent but sits on a busy road with many customers. Place C has medium rent but poor parking and weak road access. None is best on every count, so the owner must weigh rent against footfall, access and parking, for example with a factor rating table. That weighing process is location analysis.
Key terms
- Location analysis
- The systematic process of selecting the best place for a business facility.
- Factor rating method
- A method that scores each site on weighted factors and picks the highest total weighted score.
- Fixed cost
- A cost that does not change with output, such as rent or depreciation of a building.
- Variable cost
- A cost per unit that rises with output, such as materials, direct labour and freight.
- Crossover point
- The output level at which two locations have equal total cost.
- Crossover chart
- A graph of the total cost lines of alternative sites, used in location break-even analysis.
- Centre-of-gravity method
- A technique that finds a distribution point by weighting the coordinates of destinations by the volume shipped.
- Locational orientation
- The pull of a business towards raw materials, markets, labour or transport hubs.
Common questions
Why is location called a strategic decision?
Because it commits large sums for many years, is hard to reverse and shapes costs, revenue and customer service for the life of the facility.
How do the location priorities of a factory and a retail store differ?
A factory focuses on cost factors such as raw materials, transport, labour and power. A store focuses on revenue factors such as customer access, visibility, foot traffic and parking.
What is the main limitation of the factor rating method?
Its weights and scores are subjective. Different managers may reach different answers, so the weights should be agreed before scoring and the result tested by changing them slightly.
How do you find the crossover point between two sites?
Write each total cost as , set the two expressions equal and solve for . In the example above, sites B and C cross at 16,000 units.
Does the cheapest site at the expected volume always win?
Not necessarily. Qualitative factors such as quality of life, community attitude, future expansion and risk are also weighed, which is why break-even results are often combined with factor rating.
References
- Heizer, J., Render, B. and Munson, C. Operations Management: Sustainability and Supply Chain Management. Pearson.
- Stevenson, W. J. Operations Management. McGraw-Hill Education.
- Chary, S. N. Production and Operations Management. McGraw-Hill Education (India).
- Panneerselvam, R. Production and Operations Management. PHI Learning.
- Krajewski, L. J., Malhotra, M. K. and Ritzman, L. P. Operations Management: Processes and Supply Chains. Pearson.