Capacity is the maximum amount of goods or services an operation can produce in a given period. Capacity planning is the process of deciding how much capacity an organisation needs, when it needs it and in what form, so that future demand can be met without shortage or waste.
The topic matters because capacity decisions are expensive and hard to reverse. Too little capacity means delays, overworked staff and customers lost to competitors; too much means idle machines, heavy fixed costs and money locked up in unused facilities. Capacity planning is therefore about balance, and it links the demand forecast to the investment decisions of the business.
What is capacity?
Capacity simply answers the question "How much can we do?" It is always stated as a rate, that is, output per unit of time:
- A factory that can make 1,000 bottles per day has a capacity of 1,000 bottles per day.
- A college that can admit 300 students a year has a capacity of 300 seats.
- A hospital with 100 beds has that as part of its service capacity.
When output is varied, capacity is often measured by an input instead, such as machine-hours available per week in a workshop or seat-kilometres in an airline.
What is capacity planning?
Capacity planning means deciding how much capacity is needed in the future so that demand can be met properly. It answers the question: "Do we have enough ability to meet customer demand?"
A company should avoid:
- too little capacity, which leads to shortages, delays and unhappy customers;
- too much capacity, which leads to waste, idle machines and extra cost.
Capacity planning is usually done at three levels:
- Long-term (more than a year): new plants, major equipment, new branches.
- Medium-term (months up to a year): hiring, subcontracting, extra shifts, aggregate planning.
- Short-term (days and weeks): overtime, job scheduling, moving workers between tasks.
Why capacity planning is important
If capacity is too low
- orders get delayed;
- workers become overburdened;
- machines are overused and break down more often;
- customers may go to competitors;
- overtime cost increases.
If capacity is too high
- machines stay idle;
- workers are underused;
- fixed costs become a heavy burden;
- money is blocked in unused facilities.
Good capacity planning helps a business to meet demand, reduce cost, improve efficiency, use resources properly and avoid both overload and waste. It also affects the ability to compete, because spare capacity lets a firm respond quickly to new orders.
Capacity in manufacturing and services
Capacity is not only a factory idea. In services it is often harder to manage because services cannot be stored.
- Hospital: number of beds, doctors and operation theatres.
- Bank: number of service counters, employees and customers served per hour.
- College: number of classrooms, seats and faculty availability.
An empty hotel room tonight cannot be sold tomorrow, so service firms rely heavily on reservations, pricing and flexible staffing to match capacity with demand.
Measures of capacity
This is a very important exam point. Textbooks distinguish three levels.
Design capacity
The maximum possible output under ideal conditions, with no interruptions. Example: a machine is designed to produce 100 units per hour. This is a theoretical figure; in real life conditions are rarely perfect.
Effective capacity
The practical maximum after allowing for planned, normal interruptions such as:
- tea and lunch breaks;
- machine set-up and changeover time;
- scheduled maintenance;
- quality checks;
- product mix and scheduling limits.
If design capacity is 100 units per hour, effective capacity may be 85 units per hour.
Actual output
What the operation really produces. It is usually below effective capacity because of unplanned problems such as machine breakdowns, absenteeism, material shortages, quality defects and worker fatigue. If effective capacity is 85 units per hour but only 75 units are produced, then design capacity is 100, effective capacity is 85 and actual output is 75. The three figures show the gap between ideal, practical and real performance.
Key capacity formulas
Capacity for a period:
For example, a machine that produces 40 units per hour and works 8 hours a day has a capacity of units per day.
Utilisation compares actual output with design capacity:
Efficiency compares actual output with effective capacity:
Example: if design capacity is 1,000 units and actual output is 800 units, utilisation is per cent. The company is using 80 per cent of its total capacity.
Because effective capacity is never more than design capacity, efficiency is always at least as high as utilisation.
Worked example: utilisation, efficiency and machines required
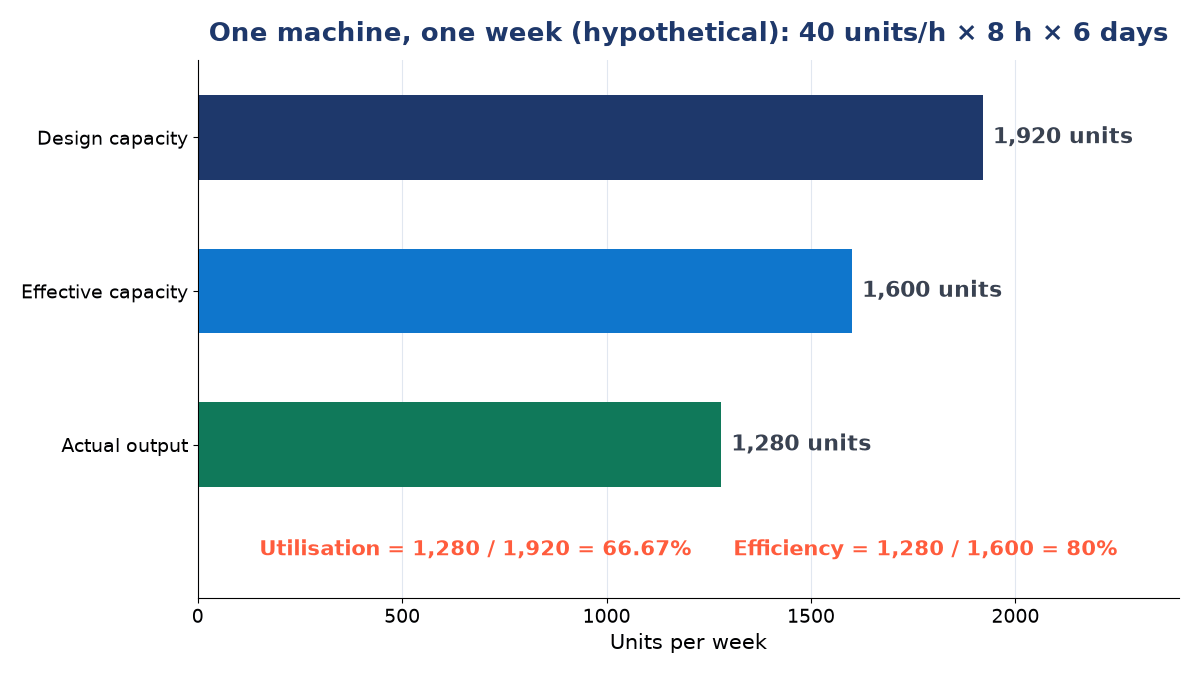
Suppose a packaging unit runs one machine rated at 40 units per hour, for 8 hours a day, 6 days a week. After allowing for set-ups and scheduled maintenance, 8 machine-hours are lost every week. Last week the machine actually produced 1,280 units.
Step 1: design capacity.
Step 2: effective capacity. Planned losses are units, so:
Step 3: utilisation.
Step 4: efficiency.
Step 5: machines needed for next year. The demand forecast is 3,000 units per week. Using effective capacity only:
But each machine really delivers only 80 per cent of its effective capacity, that is units. So:
Two machines would give only units, a shortfall of 440 units a week. The unit must either buy a third machine or raise efficiency; with two machines it would need an efficiency of per cent. This shows why realistic output, not design figures, should drive capacity decisions.
Why utilisation matters
High utilisation
High utilisation is generally good, because resources are being used well. But if it stays too high for too long, machines wear out faster, workers get tired, quality may drop, breakdowns increase and waiting times grow sharply.
Low utilisation
Low utilisation means idle resources, wasted investment and lower profit.
The goal is therefore not 100 per cent all the time but healthy, balanced utilisation with a sensible capacity cushion (spare capacity kept to absorb demand peaks and breakdowns).
A simple illustration: a bakery
Suppose a bakery can make 500 cakes per day.
| Case | Daily demand | Situation | Result |
|---|---|---|---|
| 1 | 450 cakes | Capacity is enough | Demand met comfortably, 90 per cent utilisation |
| 2 | 700 cakes | Capacity too low | Missed orders, late deliveries, lost customers |
| 3 | 200 cakes | Capacity too high | Ovens, workers and electricity underused |
The bakery must then ask: should it buy a new oven, add a shift, reduce idle capacity or train more workers? That thinking process is capacity planning.
Capacity flexibility
Capacity flexibility is how easily a business can adjust its capacity, or switch it between products, when demand changes. A garment factory that can quickly move its lines from school uniforms to office shirts has good capacity flexibility. Flexibility comes from:
- flexible plants with quick changeovers;
- flexible processes using general-purpose equipment;
- flexible workers trained in several tasks.
Factors affecting capacity planning
Internal factors
- number and condition of machines;
- worker skill and motivation;
- plant layout and facility design;
- quality of maintenance;
- working hours and shifts;
- material availability;
- production method and product design.
External factors
- market demand and seasonal changes;
- supplier delays;
- government regulations and safety rules;
- power shortages;
- transport problems;
- competition.
Some factors, such as machine breakdowns, are only partly controllable. They reduce actual output below effective capacity and must be allowed for in the plan.
Link between forecasting and capacity planning
Forecasting asks: how much demand may come in the future? Capacity planning asks: do we have enough ability to meet that demand? Forecasting comes first and capacity planning follows. For example, if the forecast says next month's demand will rise by 30 per cent, capacity planning decides whether to add workers, increase shifts, rent new machines or subcontract work.
Steps in capacity planning
- Forecast future demand for each product or service.
- Estimate the present capacity (design and effective).
- Calculate the gap between required and available capacity.
- Develop alternatives to close the gap (overtime, shifts, new machines, subcontracting, doing nothing).
- Evaluate the alternatives in money terms (for example, break-even or cost comparison) and qualitatively.
- Select and implement the best alternative, then monitor results.
Capacity timing strategies
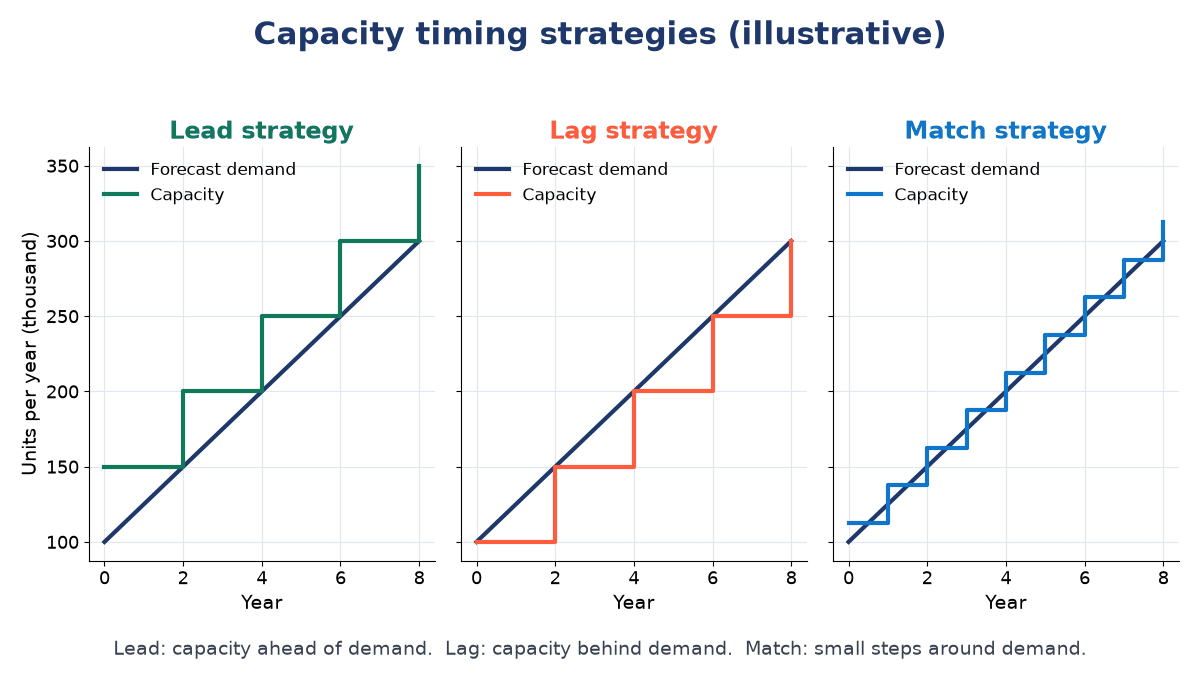
Once extra capacity is needed, the firm must decide when to add it.
Lead strategy
Capacity is added before demand increases. Example: a school builds new classrooms before admissions rise. Advantage: the firm is ready for growth and can win customers from slower rivals. Disadvantage: risk of unused capacity if demand does not grow as forecast.
Lag strategy
Capacity is added only after demand has already increased. Example: a restaurant hires more staff only after the customer rush grows. Advantage: less risk of waste and higher utilisation. Disadvantage: customers may face delays, and some may be lost, before expansion happens.
Match (tracking) strategy
Capacity is added in small steps as demand grows, so that it is sometimes slightly above and sometimes slightly below demand. Example: a clinic adds one doctor first, then another later. Advantage: a balanced approach with moderate risk. Disadvantage: needs careful planning and monitoring, and frequent small expansions can cost more per step.
| Strategy | Timing | Main benefit | Main risk |
|---|---|---|---|
| Lead | Before demand | Ready for growth | Idle capacity |
| Lag | After demand | High utilisation, low risk | Lost sales, delays |
| Match | Alongside demand | Balance | Needs close monitoring |
Problems caused by poor capacity planning
| Under-capacity problems | Over-capacity problems |
|---|---|
| Customer dissatisfaction | Idle labour |
| Delayed production and rush jobs | Unused machines |
| Overtime cost | High fixed costs |
| Quality issues | Low return on investment |
| Loss of sales | Wasted space and money |
Poor capacity planning harms both service quality and profitability.
A second illustration: school seats
Suppose a school has 10 classrooms and each can hold 40 students, giving a seat capacity of students. If only 250 students join, capacity is underused (utilisation 62.5 per cent). If 500 students apply, capacity is insufficient by 100 seats. The school must then decide whether to add classrooms, run two shifts, limit admissions or open another branch. That decision is capacity planning.
Capacity, capacity planning and utilisation compared
- Capacity: the ability to produce.
- Capacity planning: the decision process of how much capacity is needed, and when.
- Capacity utilisation: the percentage of capacity actually being used.
These three terms are often confused in exams, so learn them clearly.
Exam answer formats
5-mark answer. Capacity is the capability of an organisation to produce goods or services in a given period. Capacity planning is the process of determining the capacity required to meet future demand. It is important because it balances demand and production capability, reduces cost, improves resource use and avoids both under-capacity and over-capacity. Capacity is measured as design capacity, effective capacity and actual output. Utilisation and efficiency show how much of the capacity is actually used. Capacity planning is influenced by demand, machines, labour and breakdowns, and firms may follow lead, lag or match strategies.
Memory line. Capacity planning means arranging enough production ability to meet demand without waste or shortage. Remember four words: design capacity, effective capacity, actual output, utilisation.
Key terms
- Capacity
- The maximum output rate an operation can achieve in a given period.
- Design capacity
- The maximum output possible under ideal conditions.
- Effective capacity
- Design capacity less planned allowances such as set-ups, breaks and maintenance.
- Actual output
- The output really achieved, after unplanned losses.
- Utilisation
- Actual output as a percentage of design capacity.
- Efficiency
- Actual output as a percentage of effective capacity.
- Capacity cushion
- Spare capacity kept above expected demand to handle peaks and uncertainty.
- Lead strategy
- Adding capacity in anticipation of demand growth.
- Lag strategy
- Adding capacity only after demand has grown.
Common questions
What is the difference between utilisation and efficiency?
Utilisation divides actual output by design capacity; efficiency divides it by effective capacity. In the worked example, 1,280 units gives 66.67 per cent utilisation and 80 per cent efficiency.
Why should a firm not aim for 100 per cent utilisation?
Running flat out leaves no room for breakdowns, maintenance or demand peaks. Waiting times rise sharply, quality can suffer and equipment wears faster. A capacity cushion gives stability.
Why is effective capacity lower than design capacity?
Because real operations need planned time for breaks, set-ups, changeovers and maintenance, and the product mix and scheduling may also limit output.
Which capacity strategy is best?
It depends on the situation. A lead strategy suits growing markets where losing customers is costly; a lag strategy suits firms that want to avoid risk; a match strategy balances the two but needs close monitoring.
How is capacity planned in a service firm?
Because services cannot be stored, service firms plan capacity for peak demand and manage demand through appointments, reservations, pricing and part-time or cross-trained staff.
References
- Stevenson, W. J. Operations Management. McGraw-Hill Education.
- Heizer, J., Render, B. and Munson, C. Operations Management: Sustainability and Supply Chain Management. Pearson.
- Krajewski, L. J., Malhotra, M. K. and Ritzman, L. P. Operations Management: Processes and Supply Chains. Pearson.
- Slack, N., Brandon-Jones, A. and Burgess, N. Operations Management. Pearson.
- Panneerselvam, R. Production and Operations Management. PHI Learning.